Community sentences and orders statistics - September 2014
This page shows statistical information on the:
- Number of sentences and orders being served around the country
- Total number of sentences and orders being served
- The percentage of different types of sentences and orders
- Breakdown of the offender population by:
Number of sentences and orders by area
| Sentences | Orders | Total | |
| Auckland | 2,734 | 629 | 3,363 |
| Manukau | 4,301 | 797 | 5,098 |
| Taitokerau | 1,955 | 491 | 2,446 |
| Waitemata | 2,904 | 501 | 3,405 |
| Bay of Plenty | 1,725 | 386 | 2,111 |
| Taupo/Rotorua | 1,512 | 422 | 1,934 |
| Waikato | 2,461 | 634 | 3,095 |
| East Coast | 1,781 | 521 | 2,302 |
| Wairarapa/Manawatu | 1,581 | 435 | 2,016 |
| Wellington | 1,838 | 417 | 2,255 |
| Whanganui/Taranaki | 1,120 | 360 | 1,480 |
| Canterbury | 2,713 | 747 | 3,460 |
| Nelson/West Coast | 1,145 | 207 | 1,352 |
| Otago | 1,045 | 320 | 1,365 |
| Southland/Cental Otago | 719 | 232 | 951 |
| Other | 1 | 1 | 2 |
| Total | 29,535 | 7,100 | 36,635 |
* Refers to the total number of sentences and orders being served. An individual offender can be serving more than one sentence and/or order at any time.
Total number of sentences and orders* (monthly snapshot)
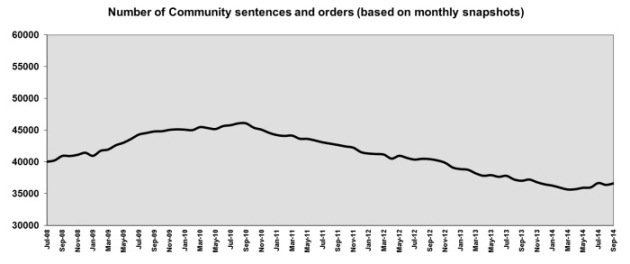
* Refers to the total number of sentences and orders being served. An individual offender can be serving more than one sentence and/or order at any time.
Proportion of different sentences and orders*
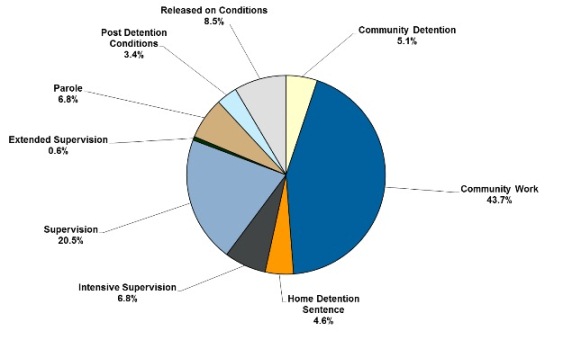
* Refers to the total number of sentences and orders being served. An individual offender can be serving more than one sentence and/or order at any time.
Percentage of offenders serving community sentences and orders in different age groups
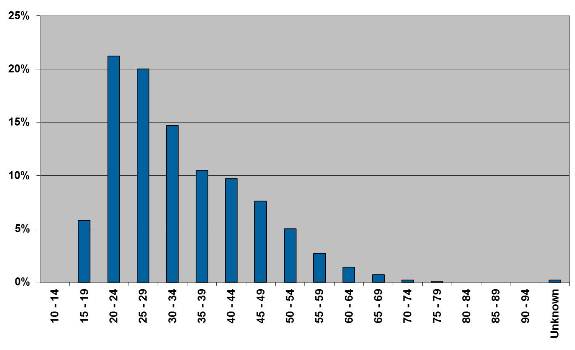
* This graph relates to the number of individual offenders serving sentences or orders in the community. An offender can be serving more than one sentence and/or order at any time.
Percentage of offenders serving community sentences and orders according to most serious* offence type
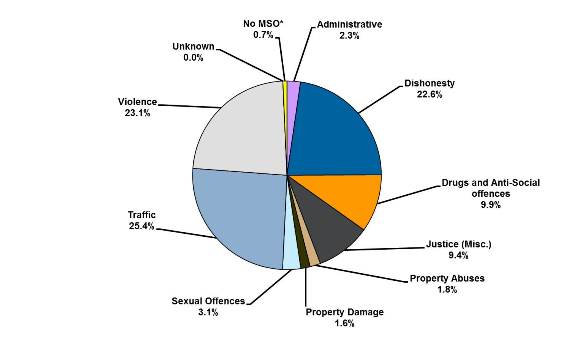
* Offenders may be convicted of offences across multiple categories. This information is based on the most serious offence a prisoner is convicted of.
Gender of offenders serving community sentences and orders
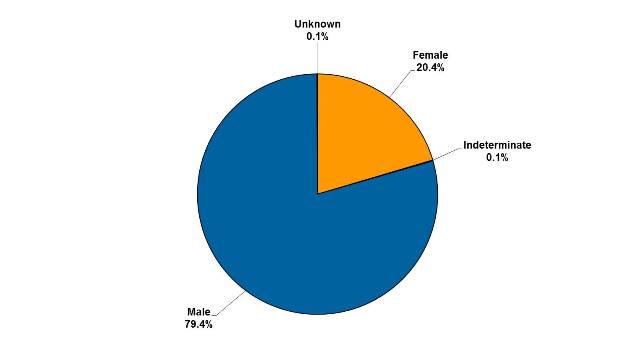
* This graph relates to the number of individual offenders serving sentences or orders in the community. An offender can be serving more than one sentence and/or order at any time.
Ethnicity of offenders serving community sentences and orders
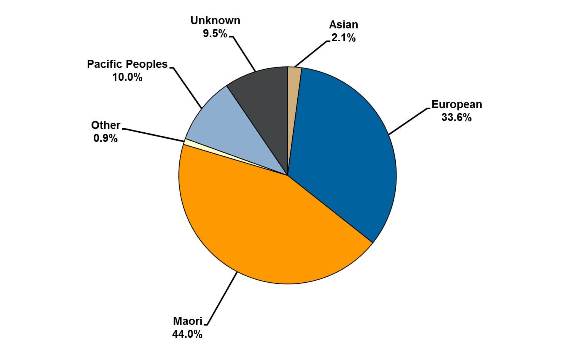
* This graph relates to the number of individual offenders serving sentences or orders in the community. An offender can be serving more than one sentence and/or order at any time.