3 Prison sentenced snapshots
3.1 Overview
This section is based on the number of offenders with prison sentenced status at given snapshot dates.
The first part of this section provides trend information based on a series of monthly snapshot dates. This is followed by a more detailed snapshot (at 30 June 2011).
In this report, when a prisoner is sentenced, time spent on remand is deducted from the sentence time remaining to serve.
3.2 Overall trend
For more details see: Data Spreadsheet
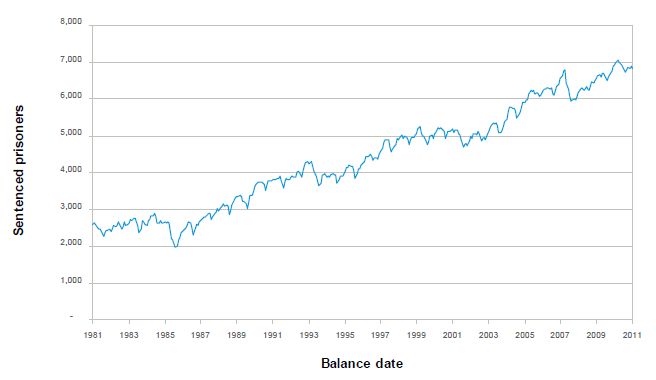
The sentenced prisoner population reflects two independent factors: new sentenced receptions to prison, and the length of time that prisoners remain in prison. Over the last decade, the number of people sentenced to imprisonment has increased, and the average period served has also increased. The latter is due primarily to prisoners subject to parole decisions being required to serve a greater proportion of the imposed sentence.
Average imposed sentence length has also increased. The drop in sentenced prisoner numbers in 2007 was associated with the
introduction of the new community sentences (amendment to the Sentencing Act 2002 and the Parole Act 2002).
Sentenced prisoner numbers fall towards the end of each year as a result of the prisoner Christmas-release policy2, and annual cycles of activity involving Police and the Courts.
Note that the trend above relates to sentenced prisoners only. To establish the total prison population, the remand snapshot figures must be added.
3.3 Gender
For more details see: Data Spreadsheet
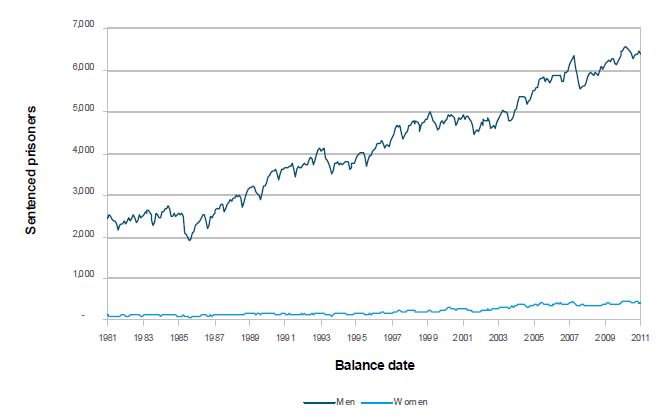
Between June 1986 and June 2011, the numbers of prison-sentenced men increased from 2317 to 6385 and prison-sentenced women numbers increased by 355 percent from 94 to 428. The proportion of prison-sentenced women has increased from 3.9 percent to 6.3 percent of all sentenced prisoners between June 1986 and June 2011.
3.4 Age
For more details see: Data Spreadsheet
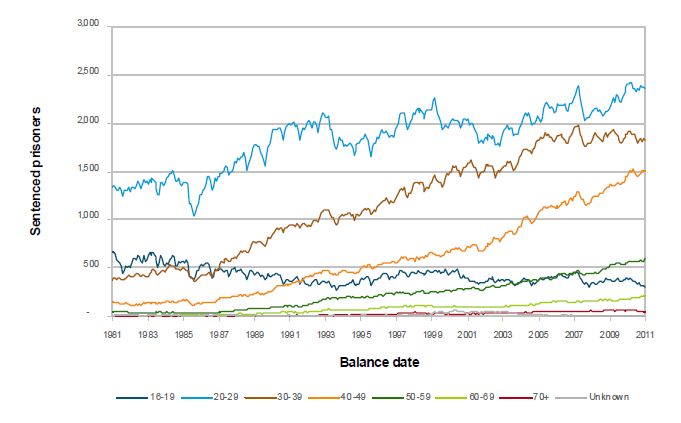
The composition of the sentenced prisoner population has changed significantly over the last 30 years. There has been a steady, long-term reduction in the numbers of sentenced prisoners in the 16-19 year old age group. However, the numbers of sentenced prisoners in other age groups increased (this is particularly evident in the 40-49 year old age group).
In 1980, prisoners aged 30 years and over made up 20 percent of the sentenced population; they now comprise over 61 percent of the total. The increase in the average age of prisoners is likely to be due to the longer times being served in prison, and a change in the types of offences committed. Also, recidivist offenders appear to be coming to prison more often, and staying longer.
3.5 Ethnicity
For more details see: Data Spreadsheet, Ethnicity - 12 Data definitions and groupings
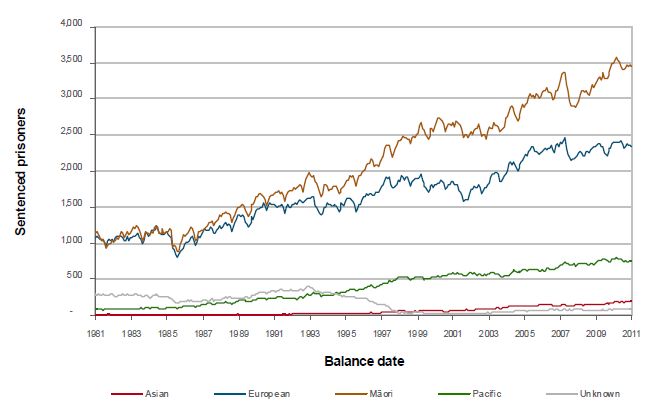
Mâori are significantly over-represented in the prison-sentenced population. There has been a large increase in the number of prison-sentenced Mâori and Pacific compared to other ethnicities. In 1981, 41 percent of all sentenced prisoners were Mâori and three percent were Pacific; this has increased to 50 percent and 11 percent respectively in 2011.
3.6 Offence group
For more details see: Data Spreadsheet, Offence grouping - 12 Data definitions and groupings
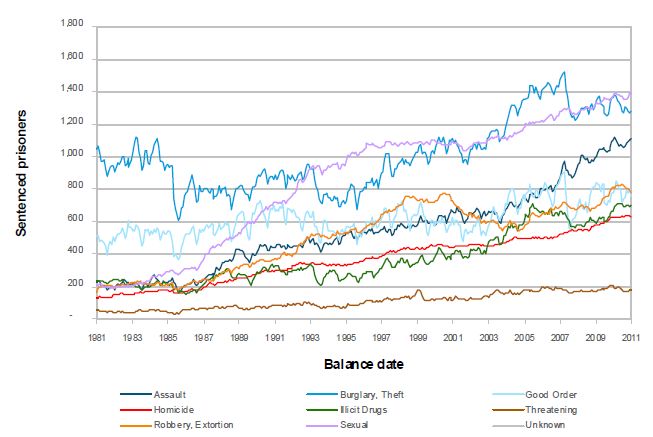
There has been a marked change in the numbers of prisoners when grouped by offence category, in the last 30 years. The assault and intended harm grouping has risen sharply (from 201 sentenced prisoners to 1111). The number of prisoners convicted of sexual offences has also increased, from 184 to 1395.
The relative proportions in each offence group is partly a reflection of longer sentences being served for more serious offences compared to less serious offences.
3.7 Prison sentence term
For more details see: Data Spreadsheet, Major management category - 12 Data definitions and groupings
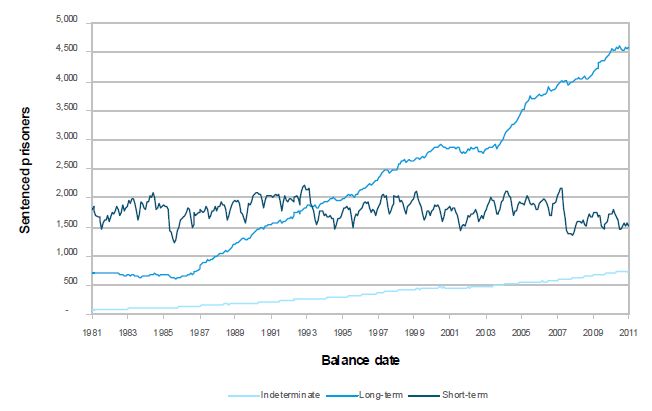
Sentenced prisoners serving long-term sentences (greater than 2 years) account for the majority of the increase in the sentenced prison population over the last two decades. The growth reflects the increase in numbers starting long-term sentences. The growth also reflects the increase in the average proportion served of the imposed sentence (currently, the average proportion of sentence served is around 70%)3.
The total number of sentenced prisoners who are in prison on any one day, with a short term of imprisonment (less than, or equal to 2 years), has remained relatively stable over the last three decades. However, the introduction of new community sentences in October 2007 had a moderate impact in reducing short-term prisoner numbers.
The number of prisoners with indeterminate sentences has increased slowly, but steadily. Although typically fewer than 50 prisoners start indeterminate sentences each year, they remain in prison for long periods, and are becoming an increasingly significant subset of the prisoner population.
3.8 Gender, ethnicity and age on 30 June 2011
For more details see: Data Spreadsheet, Multiple ethnicity - 12 Data definitions and groupings
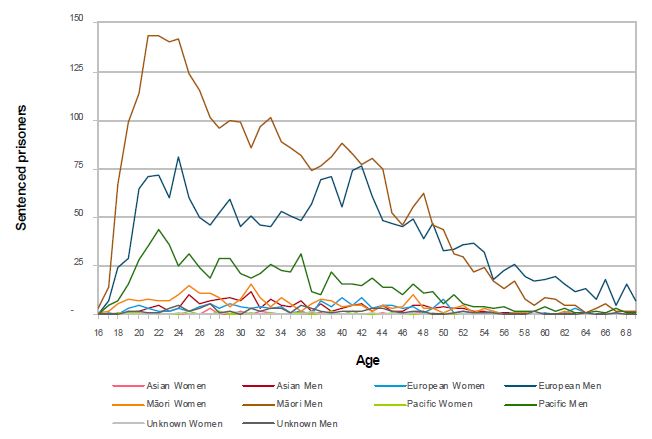
The over-representation of Mâori is evident amongst both men and women. For example, there were almost twice as many Mâori 23-year-old men in prison than there were New Zealand European men of the same age. There are similar numbers of New Zealand European men and Mâori men at older age groups. Both features contrast with the New Zealand ethnic and age demographic make up.
3.9 Sentenced imprisonment rates4 on 30 June 2011 by gender, ethnicity and age
For more details see: Data Spreadsheet, Multiple ethnicity - 12 Data definitions and groupings
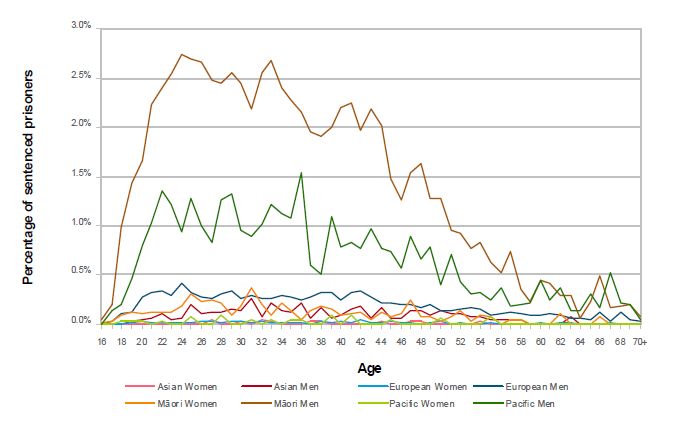
Approximately three percent of all M?ori 24-year-old men in New Zealand were sentenced prisoners on 30 June 2011. This compares with under 0.5 percent of 24 year old New Zealand European men.
3.10 Prison sentence term and age on 30 June 2011
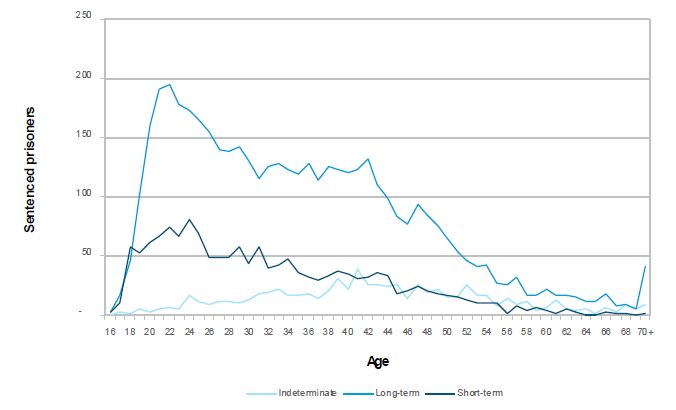
For more details see: Data Spreadsheet, Major management category - 12 Data definitions and groupings
Sentenced prisoners on long-term sentences (greater than 2 years) accounted for the majority of the sentenced prison population at almost all age groups (apart from those between ages 17 to 19).
3.11 Offence group and age on 30 June 2011
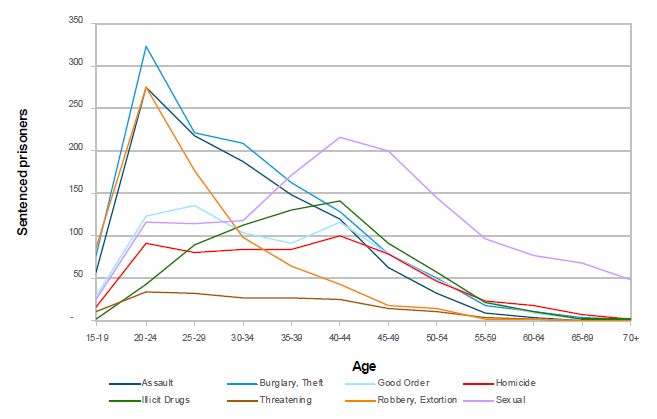
For more details see: Data Spreadsheet, Offence grouping - 12 Data definitions and groupings
The age profile by offence group reflects the varying levels of involvement of prisoners of different ages in the different groups of offences. For example, younger prisoners were more likely to be serving a sentence for assault, robbery, burglary and theft offences, whereas older prisoners were more likely to be serving sentences for illicit drug, homicide and sexual offences. Note that prisoners who have committed the latter offences usually serve longer sentences.
2Prisoners whose release date falls between mid-December and early January the following year are eligible to be released early in December.
3If sentenced to imprisonment, any time on remand in custody is counted as time served on the sentence.4The imprisonment rates for each group shown are based on the ratio of prison sentenced offenders at 30/06/2011 relative to the total population as at 30/06/2011 (as given by Statistics New Zealand Projected Ethnic Population of New Zealand, by Age and Sex, 2006 (base) for 2011 using series 6 projection). This method is imperfect due to differences in circumstances of how, when, and where the ethnicity question was asked (in prison versus in the National census). However, the numbers still provide a useful comparison.