7 Community sentenced snapshots
7.1 Overview
For every person serving a prison sentence in New Zealand there are approximately five serving a community sentence or order.
Many offenders serving community sentences may be serving more than one type of community sentence concurrently. As this report has a one-day/onestatus approach to counting offenders, offenders serving concurrent sentences are (unless otherwise noted) restricted to their single major status to avoid double counting.
Offenders managed in the community are counted according to their highest ranked status (where not overtaken by prison or prison release orders), using the order below:
- Prison
- Extended Supervision
- Home Detention
- Community Detention
- Parole
- Released on Conditions
- Intensive Supervision
- Supervision
- Community Work
- Other Community.
7.2 2007 counting rule change for offenders on community work
Since 2007 an offender on community work may be managed beyond what was originally known as the maximum completion date.
This change has opened up a new conceptual management type: that of Community Work management beyond the expected completion date. It is possible that future reports will describe this group separately. Currently however, such offenders show up as extra growth in the community work population.
7.3 Overall trend
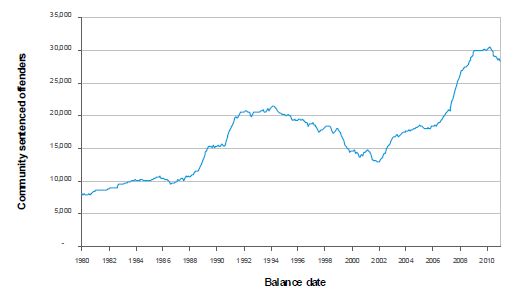
For more details see: Data Spreadsheet
The increase in the number of offenders on community sentences, shown in the figure above, is due to many factors, including:
- Merging traffic policing with general policing.
- Collections service periodically clearing backlogs of fines defaulters by escalation to Corrections’ sentences.
- Introduction of alcohol breath testing equipment.
- Introduction of blood alcohol measurement.
- Social change and changes to offending volumes.
- Changes to reporting rates (e.g. anti family violence advertising).
- Changes to prosecution volumes.
- Changes to crime resolution rates.
- Changes to prioritisation and deployment of police.
- Introduction of new sentences (recently in 2002 and 2007).
- Decline in Court use of monetary penalties.
- Introduction of new offences.
- Promotion of diversion from prison sentences.
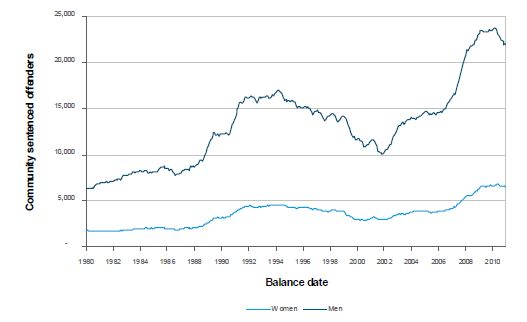
7.4 Gender
For more details see: Data Spreadsheet, Gender - 12 Data definitions and groupings
Although the total numbers managed on community sentences has changed significantly between 1980 and now, the proportion of women has remained remarkably constant, up from 22% in 1980 to 23% in 2011.
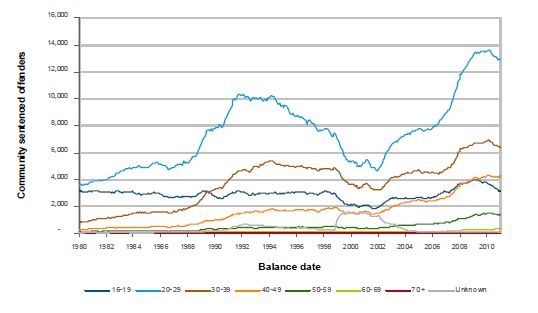
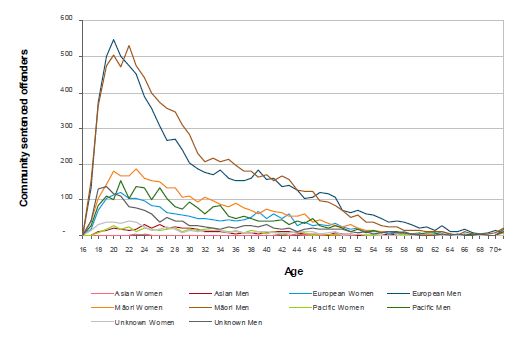
7.5 Age
For more details see: Data Spreadsheet, Gender, Age - 12 Data definitions and groupings
Note that in the figure above, and subsequent graphs, “Unknown” comprises offenders for whom the Department of Corrections’ databases contain no date of birth or ethnicity information.
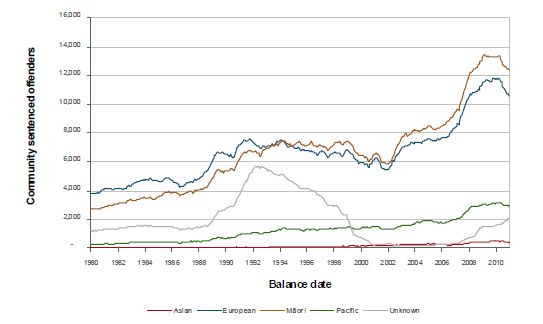
7.6 Ethnicity
For more details see: Data Spreadsheet, Ethnicity - 12 Data definitions and groupings
The number of Mâori community sentenced offenders has increased at a greater rate than European community sentenced offenders, but the most significant percentage growth has been in the numbers of Pacific offenders.
7.7 Offence group
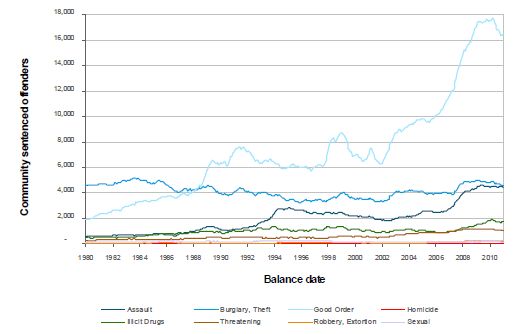
For more details see: Data Spreadsheet, Offence grouping - 12 Data definitions and groupings
The number of offenders serving a community sentence for a good order offence has increased strikingly over the last three decades. The rise is mostly due to increases in traffic and vehicle regulatory prosecutions, transferral of fines defaulters from Court collections service and enforcement of breaches of prison release orders and community sentences. Offenders for whom the offence group is unknown (between 1989 and 2000) have not been included in this figure (but see figure 13.5 in Chapter 13 Data quality).
7.8 Gender, ethnicity and age on 30 June 2011
For more details see: Data Spreadsheet
7.9 Percentage of NZ population who are on a community sentence
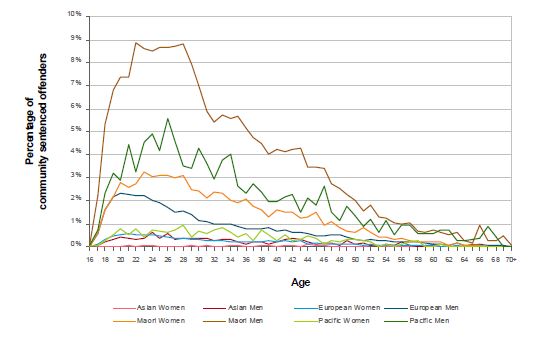
For more details see: Data Spreadsheet, Multiple ethnicity - 12 Data definitions and groupings
The figure6 above shows approximately 9 percent of Mâori 26 year old men were being managed on community sentences on 30/06/2011. The percentage of Mâori women on community sentences in most age groups exceeded that of European men.
7.10 Sentence type and age on 30 June 2011
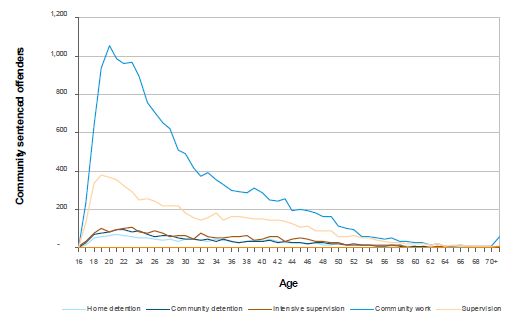
For more details see: Data Spreadsheet, Major management category - 12 Data definitions and groupings
6The per population rates for each group shown are based on the ratio of community sentenced offenders at 30/06/2011 relative to the total population as at 30/06/2011 (as given by Statistics New Zealand Projected Ethnic Population of New Zealand, by Age and Sex,
2006 (base) for 2011 using series 6 projection). This method is imperfect due to differences in circumstances of how, when and where the ethnicity question was asked. However, the numbers still provide a useful comparison.