In this section
4 Prison sentenced throughput
4.1 Overview
This section counts the prisoners starting or ending a prison sentence in each 12-month period over the last 30 years. While the prison episode starts and ends counted in this report are similar to the usual counts of receptions and releases, there are some differences. This5 report is based on electronic records of directives from the courts and the New Zealand Parole Board, not records of actual reception or release. Actual reception or release takes account of complexities, such as time under hospital management, or early
Christmas release policies.
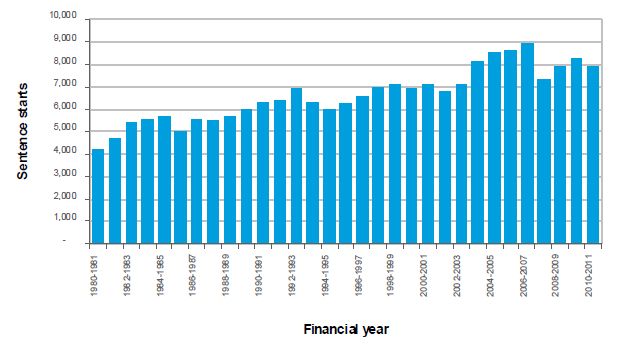
4.2 Sentence episode starts — overall trend
For more details see: Data Spreadsheet, Major management category - 12 Data definitions and groupings
The number of prisoners starting a prison sentence episode each year has increased over time. A large proportion of prisoners starting a prison sentence episode served short sentences of less than or equal to two years (see Figure 4.7).
There was a decrease in the number of new prison sentence episodes started in 2007-2008. This drop corresponds with the introduction of new community sentences in October 2007, which targeted lower-risk, lowerseriousness, offenders. The number of prisoners starting a prison sentence episode increased in the following two years, but has dropped again slightly in 2010-2011.
4.3 Sentence episode starts — gender
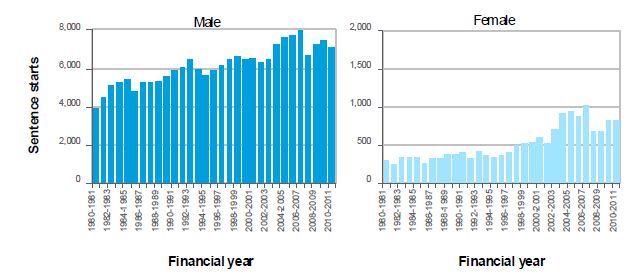
For more details see: Data Spreadsheet, Gender - 12 Data definitions and groupings
4.4 Sentence episode starts — age
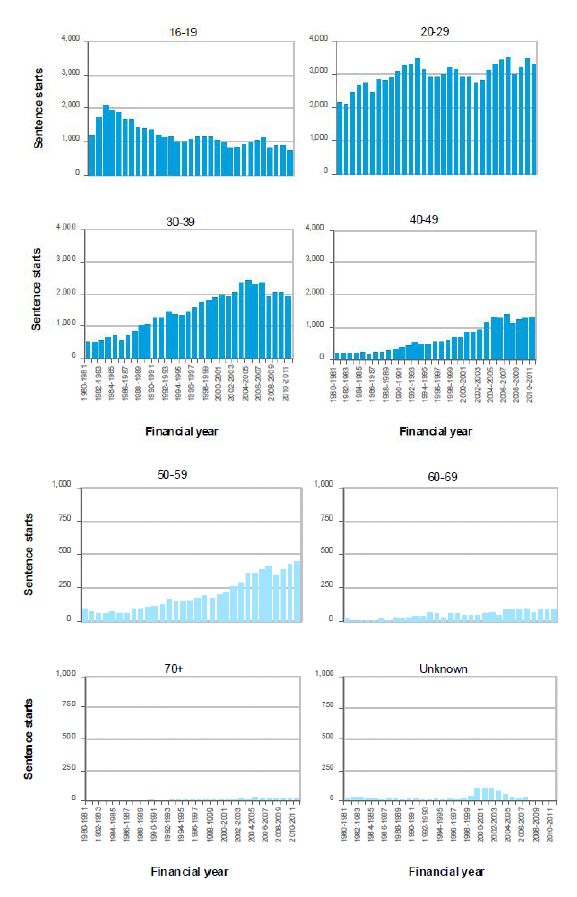
For more details see: Data Spreadsheet, Age - 12 Data definitions and groupings
4.5 Sentence episode starts — ethnicity
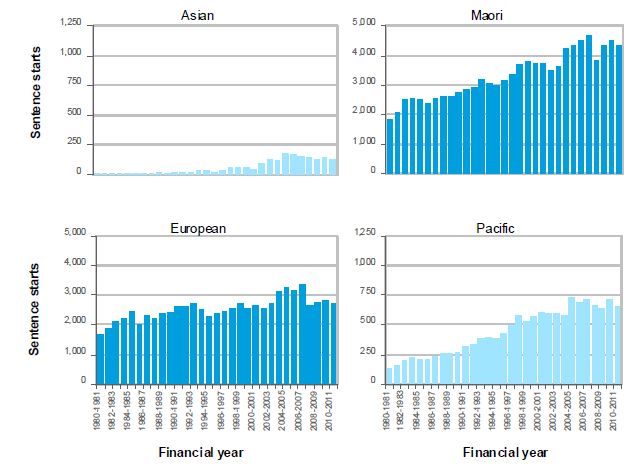
For more details see: Data Spreadsheet, Ethnicity - 12 Data definitions and groupings
4.6 Sentence episode starts — offence group
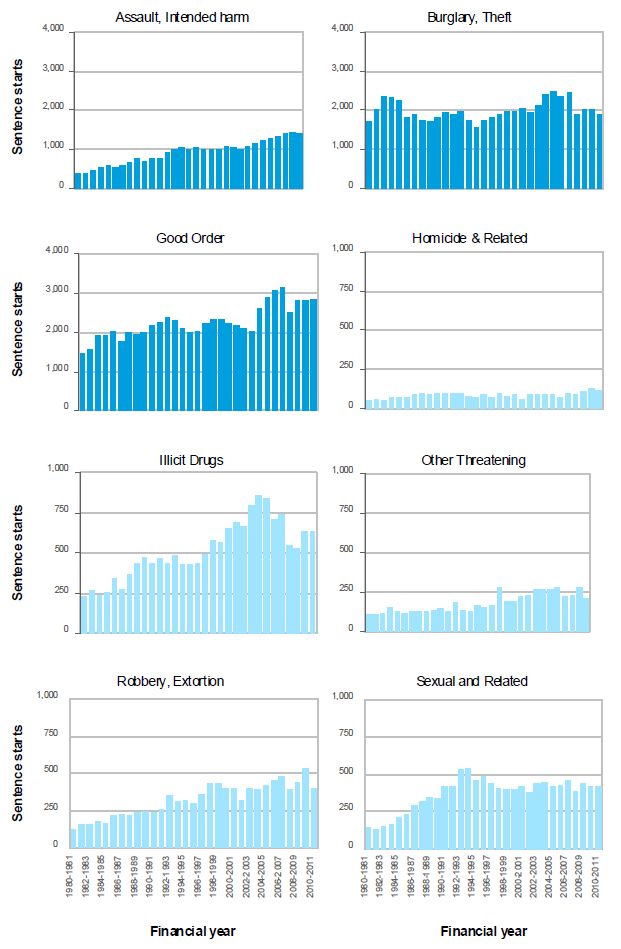
For more details see: Data Spreadsheet, Offence grouping - 12 Data definitions and groupings
Good order, burglary, theft, fraud, and assault and harm, have made up a large proportion of new prison sentence episodes started over the last thirty years.
Although the number of new prison sentence episodes started for homicide, and sexual and related offences are relatively low, these prisoners stay in prison for long periods, and thus form a large proportion of the muster at any given point in time.
4.7 Sentence episode starts — prison sentence term
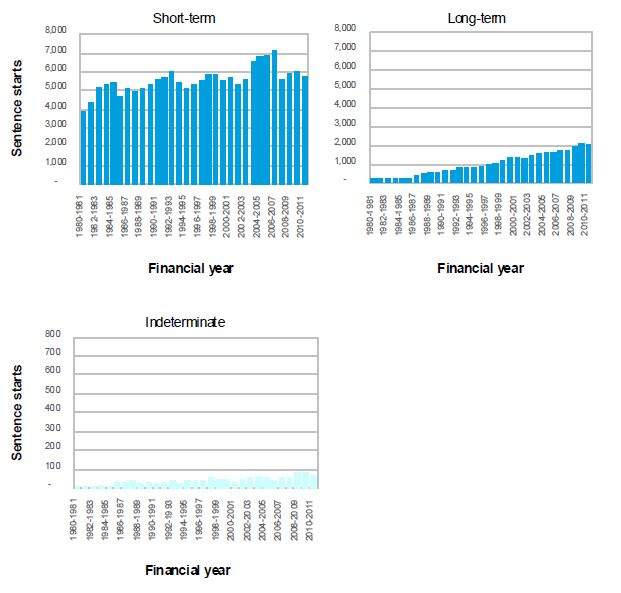
For more details see: Data Spreadsheet
While short-term prison sentences (2 years and below) currently make up almost three-quarters of the number of new prison sentence episodes started, they comprise less than a quarter of the total number of sentenced prisoners (as shown in Figure 3.7).
4.8 Sentence episode starts — age at reception in 2010/11
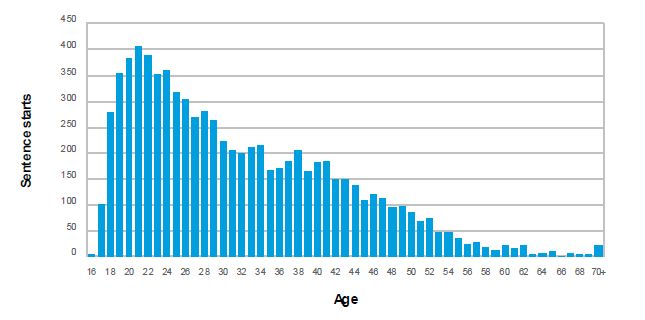
For more details see: Data Spreadsheet
4.9 Sentence episode starts — prior major management category in 2010/11
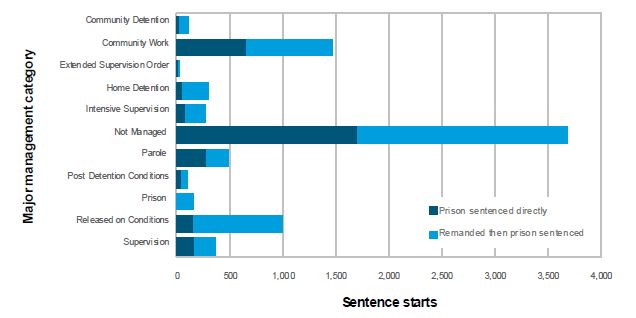
For more details see: Data Spreadsheet, Major management category - 12 Data definitions and groupings
The figure above represents the distribution of the prior major management category at the start of the current prison sentence episode. However, if the prior major management category was remand, the major management category prior to remand is shown.
Sixty percent of newly sentenced prisoners were remanded in custody immediately prior to the commencement of their sentence (light blue).
Around 55 percent of offenders starting a prison sentence were already being managed by the Department of Corrections at the time of their imprisonment.
Some offenders included above are recalled directly to prison from a community order, for example, offenders who breach the conditions of their parole.
4.10 Sentence episode ends — major management category in 2010/11
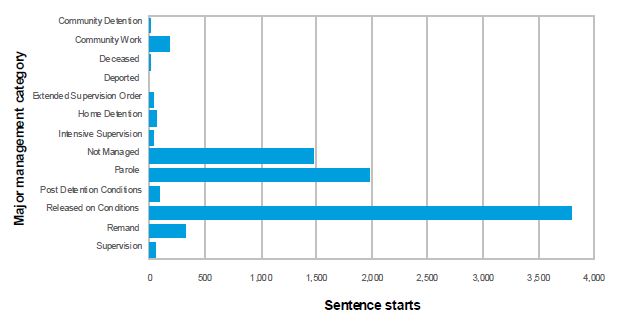
For more details see: Data Spreadsheet, Major management category - 12 Data definitions and groupings
The figure above shows that 18 percent of those completing a prison sentence episode did not continue with some form of management by the Department of Corrections immediately afterwards (‘not managed’).
The majority of prisoners transitioned to parole or release conditions after completing their prison sentence. A small number of prisoners transitioned directly to remand after completion of their prison sentence.
4.11 Sentence episode ends — actual months served in 2010/11
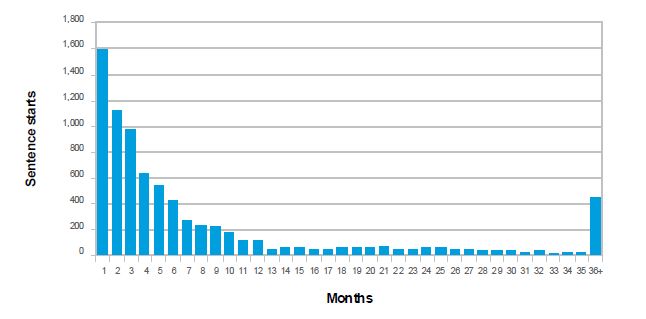
For more details see: Data Spreadsheet
The majority of people who completed a prison sentence episode spent relatively short periods of time (less than six months) in prison as sentenced prisoners. Eighteen percent of prisoners released each year have spent more than one year in prison, while just over five percent of prisoners released each year have spent more than three years in prison.
4.12 Sentence episode ends — cumulative percentage of releases (by month)
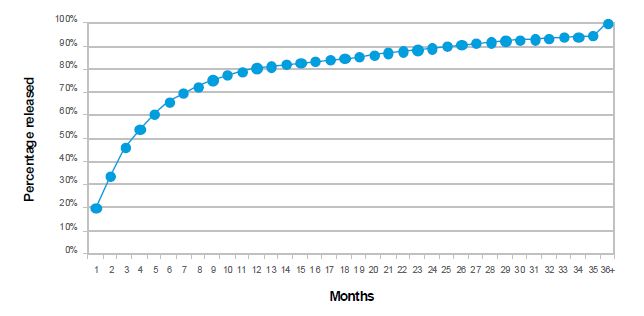
For more details see: Data Spreadsheet
Around 20 percent of sentenced prisoners are released within one month. By three months around 50 percent of sentenced prisoners are released. By 12 months the proportion reaches 80 percent, but then levels off markedly. The figure above excludes time spent on remand.
5The Offender Volumes Report 2009 included prison sentenced episodes of zero duration. This years report does not include zero duration prison sentences which mostly arose from remand time served exceeding sentenced time to serve with immediate release at time of sentencing.