Prison Performance Table methodology before July 2015
Overview
The Prison Performance Table assesses prison performance across core security, internal procedures and rehabilitation performance. Both the internal procedures and rehabilitation performance measures are comprised of numerous Key Performance Indicators (KPIs). Each KPI is assigned a pre-determined weighting to reflect the significance the Department places on each measurement indicator. Most of the positive KPIs used to calculate the rehabilitation score for Mt Eden Corrections Facility (MECF - privately managed prison) are different from the other prisons.
1.0 Core Security Gateway
The core security gateway is a test for certain incidents that are considered unacceptable, regardless of the number of prisoners or any other factors.
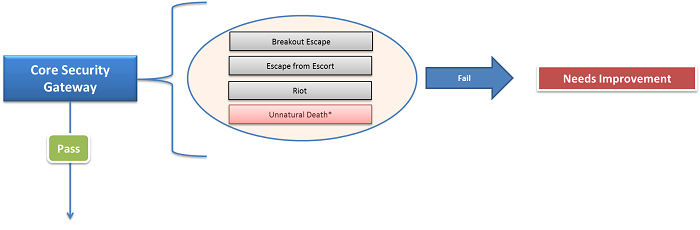
* Upon confirmation from the National Commissioner that the death is due to a site level failure
If a prison has no core security incidents in the current quarter, the prison proceeds to the Internal Procedures Gateway.
2.0 Internal Procedures Gateway
The internal procedures gateway is a test to check if a prison is meeting minimum requirements to be a safe and secure facility.
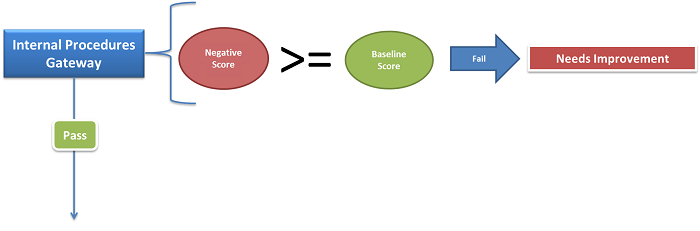
The baseline score reflects the unique characteristics of each prison including population size, type of population and population turnover.
The negative score reflects the negative incidents that occur, weighted to reflect the severity of the incident type. The prison will fail the internal procedures gateway if the negative score is greater than or equal to the baseline score. Both the baseline and negative scores are calculated using a weighted average: Current quarter – 40%, Previous quarter – 30%, Two quarters back – 20%, Three quarters back – 10%.
If this gateway is passed, the prison proceeds to the Rehabilitation Performance grading.
2.1 Baseline Score
i. The model creates an initial baseline score for average population by security classification and sentence status. Each security classification and prisoner status group is given a pre-determined weighting based on the likelihood of negative KPI events occurring within that group.
| Sec. Class / Sentence Group | Avg. Monthly Volume | Weighting | Initial Score |
|---|---|---|---|
|
Minimum |
22 |
0.1 |
2.20 |
|
Low |
118 |
0.2 |
23.60 |
|
Low Medium |
427 |
0.25 |
106.75 |
|
High |
251 |
0.4 |
100.40 |
|
Maximum |
2.67 |
0.3 |
0.80 |
|
Unclassified |
27 |
0.4 |
10.80 |
|
Remand - accused |
131 |
0.35 |
45.85 |
|
Remand - convicted |
14.7 |
0.35 |
5.15 |
|
Total |
993.37 |
|
295.55 |
ii. The effect of throughput of new prisoners on operating conditions:
a. Calculate the rate of new receptions per prisoner for each prison. For example:

b. Calculate the new prisoner factor.

iii. Arrive at the baseline score for the prison for the current quarter.

2.2 Negative Score
| Negative KPI | Volume (Quarter) | Weighting | Negative Score |
|---|---|---|---|
|
Serious Assault (Prisoner / Prisoner) |
1 |
50 |
50 |
|
Serious Assault (Prisoner / Staff) |
- |
100 |
- |
|
Non-serious Assault (Prisoner / Prisoner) |
- |
1 |
- |
|
Non-serious Assault (Prisoner / Staff) |
2 |
2 |
4 |
|
Breakout Escape |
- |
120 |
- |
|
Escape (from Escort) |
- |
120 |
- |
|
Escape (Abscond) |
- |
60 |
- |
|
Escape (Breach temporary release) |
- |
60 |
- |
|
Number of justified complaints - 1 |
2 |
5 |
5 |
|
% of positive random general drug test results >10% |
18% |
30% of Baseline Score |
93.1 |
|
Self-harm threat-to-life |
- |
35 |
- |
|
Wrongful Detention |
1 |
25 |
25 |
|
Wrongful Release |
- |
25 |
- |
|
Disorder event |
1 |
30 |
30 |
|
Significant Disorder Event (Riot) |
- |
120 |
- |
|
Total |
|
|
207.1 |
The negative score for the current quarter is 207.10.
2.3 Weighted Average Score
A weighted average score across four quarters is used to reduce the effect of isolated incidents in any particular quarter.
For example, if the baseline scores for the previous three quarters are 301.15, 316.80, and 295.00, then the final baseline score used in PPT is:

If the negative scores for the previous three quarters are 160, 250, and 225, then the final negative score used in PPT is:

In this case, negative score (final) < baseline score (final) and the prison proceeds to be graded based on the rehabilitation performance.
3.0 Rehabilitation Performance
Subject to the two gateways described above, the rehabilitation performance grade determines the overall performance grade. The rehabilitation performance score is based on a four quarter rolling average.
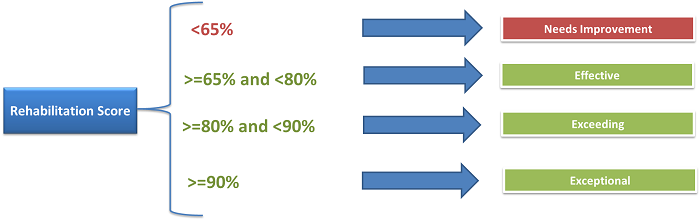
Each prison is set a minimum requirement and a maximum level of performance for each positive KPI. If the prison performance is below the minimum level, no score is awarded. If the prison performs between the minimum and maximum levels, a pro-rata calculation is used as follows – if a prison had a minimum level of 75% and a maximum level of 95% for a KPI and they scored 80%, they have achieved 84% of the maximum level. They will therefore be awarded 84% of the possible points (weighting) for the KPI.
An average rehabilitation score across four quarters is used to reduce the volatility of table position quarter on quarter.
The below table shows the positive KPIs used to calculate the rehabilitation score for a prison (other than MECF). For example, if the prison scored a rehabilitation score of 72.58% (74.03/102) for the current quarter and the rehabilitation scores for the previous three quarters are 82%, 66%, and 74%, then the overall rehabilitation score for the prison is 73.65% ((72.58+82+66+74)/4) resulting in an “Effective” performance grade.
| Positive KPI (Public prisons) | Weighting |
|---|---|
| % of prisoners completing programme |
18 |
| % of prisoner starts against plan |
18 |
| % of initial offender plans on time |
18 |
| % of prisoners progressing in literacy and numeracy education |
18 |
| Hours spent in structured activity per prisoner per day |
3 |
| % of prisoners entitled to offender plan that received one |
15 |
| 25% of prisoners engaged in employment |
12 |
| Total |
102 |
The KPIs used for rehabilitation score calculation for MECF is shown below. If the prison scored a rehabilitation score of 97.60% (137.62/141) for the current quarter and the rehabilitation scores for the previous three quarters are 95%, 98%, and 93%, then the overall rehabilitation score for the prison is 95.90% ((97.6+95+98+93)/4) resulting in an “Exceptional” performance grade.
| Positive KPI (MECF) | Weighting |
|---|---|
| % of initial offender plans on time |
18 |
| Hours spent in structured activity per prisoner per day |
3 |
| % of prisoners entitled to offender plan that received one |
15 |
| Attitudes and Self Control Pathway |
15 |
| Children and Family Networks Pathway |
15 |
| Education, Training & Employment Pathway |
15 |
| Finance and Debt Management Pathway |
15 |
| Drug and Alcohol Misuse Pathway |
15 |
| Mental and Physical Health Pathway |
15 |
| Accommodation Pathway |
15 |
| Total |
141 |