13 Data quality
13.1 Quality checks
The data enrichment process has ensured that offenders and offender status are conserved over time. Where it has been possible to find a record from the Court or New Zealand Parole Board directives that justifies a change in status, an offender’s status has been updated.
Each offender status, on each day, is auditable to the extent that it can be traced back to an electronic record, giving a date and directive mandated by the Courts or the New Zealand Parole Board.
A number of quality checks have been undertaken, including the following:
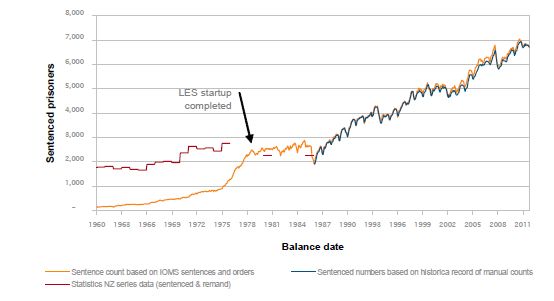
- Comparison of the offender prison sentenced snapshot trend numbers against the historical record of actual musters trend.
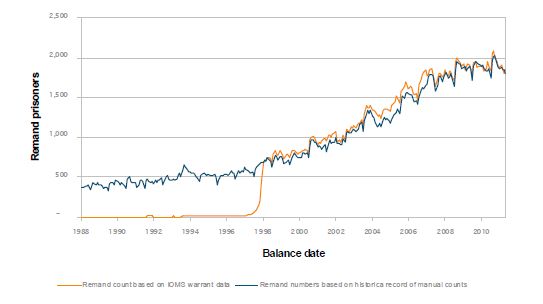
- Comparison of snapshots of remand prisoners with historical lists of muster prisoners on the same days.
- Comparison of counts from the community sentenced source data with historical reporting. Accurate matching is not possible due to different counting rules, but the scale and shape of Ministry of Justice data gives confidence that the differences are primarily due to avoiding double counting offenders in different categories.
- Comparison against recent standard reports of Community Probation Services activity.
A number of data issues have surfaced during the preparation of this report as a result of the rigid requirement that offender status is conserved and carried forward from year to year unless a directive to change the status is located. Most issues that have been identified have been managed or minimised. The data-set used is comprehensive and accurate within the limits of available data.
Because of the introduction of the Law Enforcement System in the 1970s, it has been possible to build a continuous and reasonably accurate history of all New Zealand offenders spanning over 30 years.
13.2 Prison sentenced data compared to prison muster data series
For more details see: Data Spreadsheet
In addition to holding records relating to each prisoner’s directed status, the Department of Corrections holds complementary data relating to actual manual prison muster records. The data sets closely align, but are not identical, as the actual offender disposition can be affected by deaths, escapes, movements to psychiatric facilities, hospital visits, court stays, and temporary releases. Both data sets can have data latency issues and errors. Comparing the data-sets, as shown above, provides confidence that each is meaningful.
From the figure above, it can be seen that after the start-up of LES in 1976, the overall match between the prison sentenced and sentenced muster data appears healthy. The effect of back entering only criminal histories for those offenders managed post LES start-up is seen in the way prison sentenced numbers are only a proportion of muster numbers before 1976.
13.3 Remand directives data compared with remand muster data series
For more details see: Data Spreadsheet
Remand episodes are derived from the Department of Corrections’ electronically recorded remand directives. It has been difficult to analyse these since actual management is still done largely on paper-based systems, rather than electronically. One issue has been that the Departmental data does not currently include explicit closure of remanded in custody periods
when bail has subsequently been granted. Further, there is a lack of explicit data on closure of remand directive records when an individual goes to Court and does not return, due to being given a non-custodial sentence or being acquitted. When individuals are remanded in police cells and police haven’t requested the use of the Department’s facilities for the remand prisoner, then the Department’s muster reporting processes exclude the remand prisoner.
Quality checks of the directed remanded in custody counts, compared with the actual manual muster counts, show a gap of up to 100 extra individuals apparently directed to custody on any day relative to actual remand muster records. The overall match, pattern and meaningfulness of the directed status information is good as shown above.
13.4 Multiple identities per offender
For more details see: Data Spreadsheet
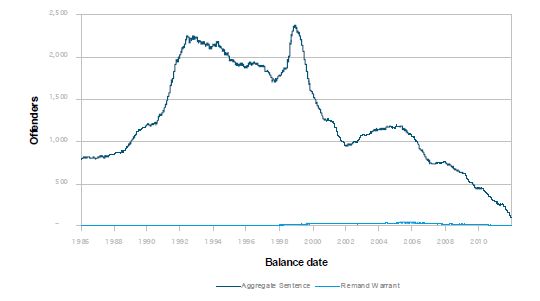
This document uses the identities as established in the Department of Corrections’ data bases. An analysis of the data indicates that, at various periods of time, the Department has generated multiple identities for some individuals. This means that some counts of offender/prisoner numbers are subject to over-representation. The following figure provides an indication of the maximum potential miscount over all active offenders during any year.
The peak in 1998 is associated with the commencement of IOMS.
13.5 Test court, unknown offence and community service in the 1990s
For more details see: Data Spreadsheet
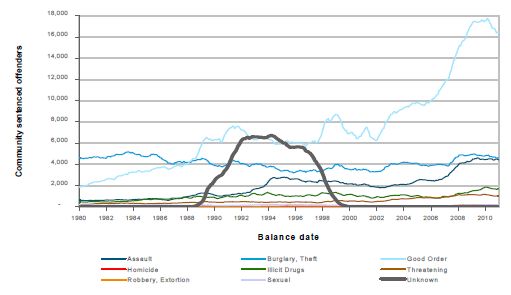
Included in the Department of Correction’s records is an unusual bulge of offender management where the data indicates only that some unknown offence was processed through an unknown court and resulted in community service.
This data was previously filtered out of the 2007 and 2009 Offender Volumes Reports but is included this time for completeness pending further investigation.
13.6 Community Work closures
For more details see: Data Spreadsheet
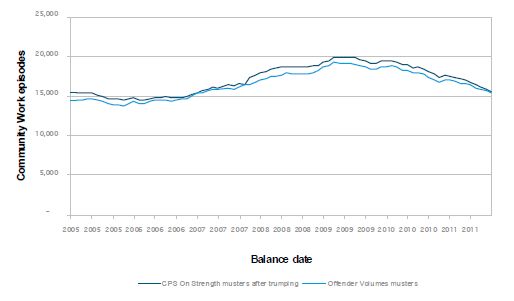
The counting rules used for identifying the completion of management of Community Work episodes used in this report does not align exactly with the counting rules applied for most Community Probation Services reporting. Further investigation of the differences is required, but it is likely that this is because of the timing between formal closure of Community Work management and presumed closure due to completion of required hours of work.

