Reconviction Patterns of Released Prisoners: A 36-months Follow-up Analysis
March 2007
Introduction
This report summarises patterns of reconviction amongst almost 5000 offenders who were released from prison over a twelve-month period in 2002/03. It reveals important differences in the post-release re-offending behaviour of different sub-groups of offenders. Offender characteristics such as age (at time of release), gender, ethnicity, offence type 1, length of the prison sentence, and risk level 2, are each examined with reference to reconviction.
The outcome data presented here are based on the "recidivism index" (RI) methodology used in the Department of Corrections' (the Department's) annual reporting of reconviction. The method quantifies the rate of reconviction of a specified group of offenders over defined follow-up periods after release from a custodial sentence, or from the start date of a new community sentence. The current analysis gives reconviction rates over 36 months for those released from prison during the 2002/03 (1 April - 31 March) year. Reconviction information was obtained from the Ministry of Justice's Case Management System (CMS) database. The conviction dataset included any reconviction for an offence that occurred within 36 months of each individual offender's release date (upto 31 March 2006) 3.
Two main figures are produced: reconvictions leading to any sentence administered by the Department, and reconviction leading to a term of imprisonment (the former is inclusive of the latter). Whereas the majority of reconvictions lead to non-custodial sentences, imprisonment figures are generally considered the more critical of the two measures, as this outcome is associated with more serious offences and higher costs of sentence administration.
RI figures exclude reconvictions which result in sentences not administered by the Department (for example, fines, discharge following conviction). Such outcomes are usually associated with relatively minor offending that has little significance for public safety. As is also common internationally with measures of this type, the figures exclude reconvictions for administrative offences (e.g., breaches of parole, failure to complete community work). The sample however includes offenders released from prison after serving sentences for administrative offences.
It is also important to note that the figures here (with one exception) represent any reconviction or re-imprisonment during the 36-month follow-up period. Some of the individuals re-imprisoned may well have had multiple, successive terms of imprisonment during that period. However, full analysis of such patterns must await subsequent reports.
It is of course acknowledged that reconviction figures give only an indication of actual re-offending. Surveys of crime victims indicate that, on average, between 35 - 40% of all crimes are reported to Police. Further, even when reported, not all crimes are resolved. The latest Police crime statistics suggest that resolution rates can vary from around 80% for violent offences to as low as 20% for dishonesty offences. Finally, a proportion of crimes may be "resolved" but do not necessarily progress to the conviction and sentencing of an offender (e.g., Police Diversion cases).
Thus no attempt is made here to suggest that the figures in any way account for the full extent of actual re-offending behaviour of this cohort of released prisoners; these inevitably must be considerably higher. However, given the reasonable assumption that offenders in the various sub-groups are, if they do offend, approximately equally likely to come to the attention of the Police, then the figures almost certainly tell us something important about the post-prison offending behaviour of released prisoners.
Overall recidivism rates
Across the entire sample of offenders released from New Zealand prisons during the criterion period, 44% were convicted of a new offence and were returned to prison at least once during the follow-up period.
To give more background to this reconviction figure, the relationship between time and re-imprisonment can be examined. The lower (blue) line in the graph immediately below shows the spread of re-offending over the three-year follow-up period. Numbers re-imprisoned rise steadily in the initial phase, such that by the one-year mark, 26 percent of the sample had already been reconvicted and returned to prison. By the two-year mark 37 percent of the sample had been re-imprisoned, with the 44 percent figure being attained at by the end of the 36 months.
Table 1: The relationship between time and first re-offence
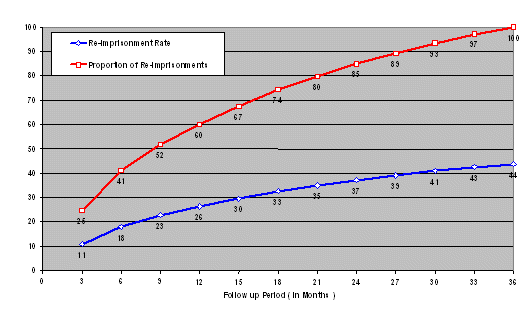
The upper (red) curve in the above graph shows the proportion of the recidivating group (in percentages) returned to prison after three months, six months and so on, up to 36 months. This shows, for example, of those who did recidivate, 60 percent had been re-imprisoned by twelve months. From that point the rate of re-imprisonment slows, with a further 25 percent returned to prison by the 24-month point, and the remaining 15 percent of recidivists during the last twelve months. Projecting forwards, the shape of this curve suggests that, after five years (60 months), around 50 - 55 percent of the entire sample will have been returned to prison (at least once). This figure is consistent with a (May, 2002) study by the Ministry of Justice, which revealed that 51 percent of prisoners released between 1995 and 1998 were returned to prison within five years.
The following sections present more detailed results of the overall figures by different breakdowns of offenders and offences. As noted, these detailed breakdowns provide potentially useful perspectives on offenders released from prison. Information is presented on the re-imprisonment rates of offenders broken down by age, gender ethnicity, most serious offence sentenced, and previous criminal histories.
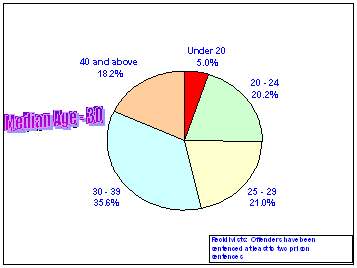
Re-imprisonment by age
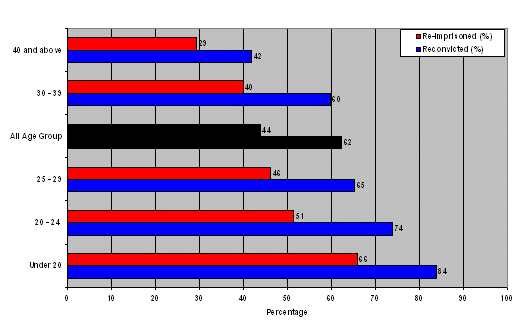
Clear differences in reconviction rates by age emerge in many studies of criminal justice populations, with the youngest offenders usually having considerably higher reconviction rates. The graph below gives rates of re-imprisonment for offenders of different age bands in the current sample. This shows that exactly two-thirds of those aged under twenty were re-imprisoned. This rate is over twice that which applies to offenders aged over 40.
Table 2: Reconviction and re-imprisonment rate by age group
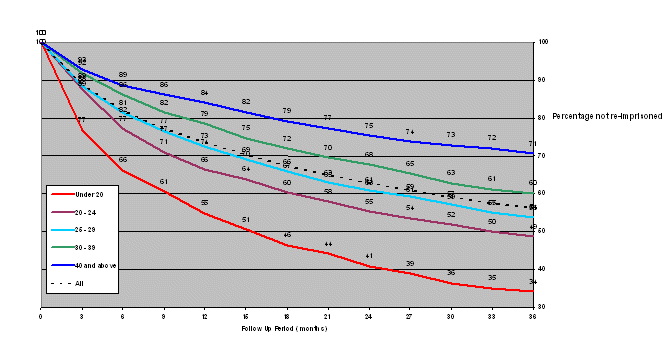
The following table shows the survival curves 4 of the sample, again by age bracket. Particularly notable is, once again, the youth (< 20 years) survival rate. Almost half of that group had been re-imprisoned within 15 months.
Table 3: Percentage of offenders survived by age group over 36 months
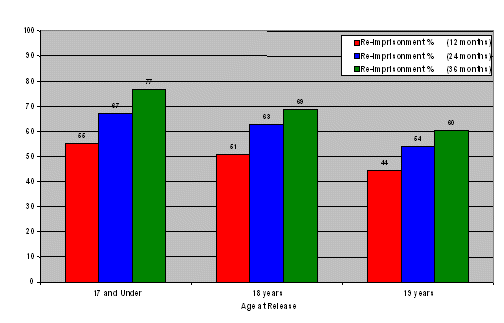
The following table and graph gives a more fine-grained analysis of the youth offenders in the sample. This again reveals the pronounced (inverse) correlation between age and re-imprisonment, even between single year steps. Fully 77 percent of offenders aged 17 at time of release were returned to prison, while the rate for those aged 19 was almost a quarter less. This is in part likely to reflect the fact that offenders who receive sentences of imprisonment by age 17 are likely already to have a significant history of juvenile offending, which is itself predictive of future, persistent criminality.
Table 4: Re-imprisonment rate by age, under 20s (12, 24, 36 months Follow up)
Reconviction rates by ethnicity and gender
Information on ethnicity and re-imprisonment is shown in Table 5. Ethnicity is recorded by the Department at the time of reception to prison, and reflects the offender's self-reported ethnicity. Figures indicate that Maori offenders have the highest rates of reconviction, followed by NZ Europeans, then Pacific offenders. These differences are likely to be a reflection of a number of confounding variables. For example, the Maori sub-group of offenders was on average younger than the European (see Appendix 1: the age distribution of Maori and non-Maori are somewhat different, with Maori tending to feature in larger numbers in younger age bands). Maori are also more likely to be serving time for offences which have high "base rates", such as dishonesty offences. Similarly, Pacific offenders tend to be in prison for offences which have relatively low base rates (violence, sex). Although the higher re-imprisonment rate for Maori no doubt contributes to the disproportionate number of Maori in prison, its impact is dwarfed by the very large numbers of young Maori who enter the criminal justice system for the first time each year.
Table 5: Reconviction and re-imprisonment rate by ethnicity (36 months follow-up)
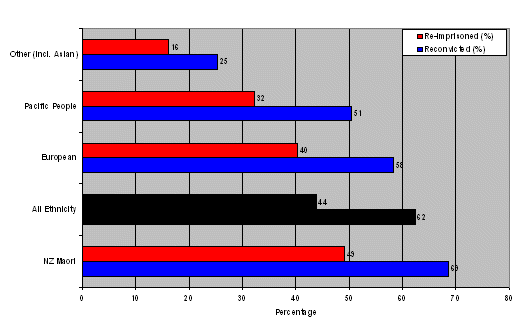
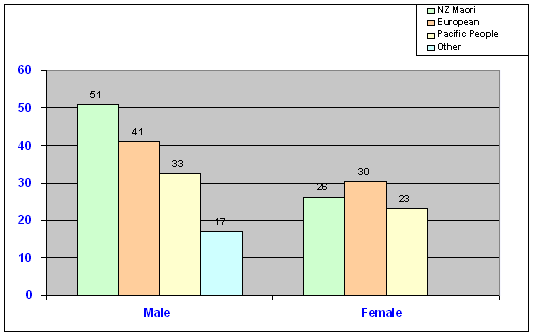
These figures are further broken down by gender, shown in Table 6, which indicates that, in general, female offenders are considerably less likely to be re-imprisoned than are males. Interestingly, the higher rate of re-imprisonment apparent amongst Maori males is not present for Maori females in this sample, something that possibly warrants further analysis.
Table 6: Re-imprisonment rate by gender and ethnicity (36 months follow-up)
Reconviction by sentence length
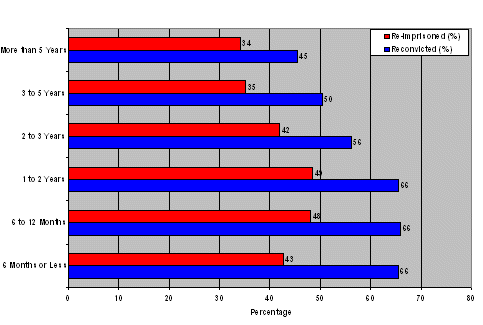
The graph below shows how reconviction rates vary by the length of custodial sentence from which the offender was released 5. Overall, offenders released after serving longer custodial sentences had lower re-imprisonment rates. While this might suggest that longer sentences are effective in lowering re-offending rates, as was the case with ethnicity there are a number of "confounds" - associated variables that might also explain the differences. These include the fact that offenders released from longer sentences tend to have committed offences with a lower "base rates" (e.g., offenders who commit sexual offences typically serve longer sentences, but as a sub-group tend to have the lowest rates of reconviction - see Table 11 below). Further, offenders who serve longer sentences are more likely to have completed a range of rehabilitative interventions (addressing their educational, employment, criminogenic and reintegrative needs). It could also be argued that they are less likely to return to the specific social and interpersonal circumstances that may have precipitated the earlier offending. While it might also be expected that long-serving prisoners tend to be older, and thus lower-risk at time of release, in this sample the median age of those serving more than two years was almost identical to those serving two years or less (30 years vs 29 years respectively).
Table 7: Reconviction and re-imprisonment rate by aggregate sentence length (36 months follow-up)
Reconviction by previous sentences
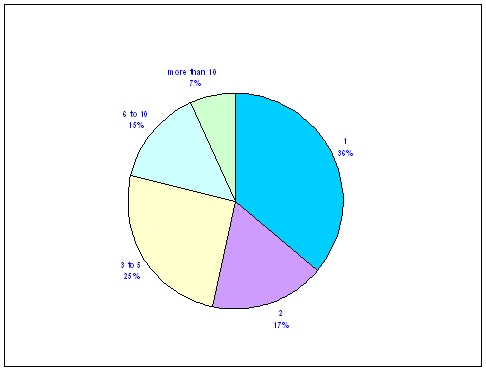
The figure below indicates, for the 2002/03 sample, the proportion who had served previous terms of imprisonment. Of interest here graph is that 36 percent of the sample were released from their first prison sentence (that proportion denoted as having one previous term). A quarter of the sample had served between three and five previous terms, and seven percent had served more than ten previous terms. A similar picture emerges when their histories of both prison and community sentences are examined: about one in six had no such previous sentences (although they may have previously been fined, or convicted & discharged).
Table 8: Prison releases by previous prison sentences
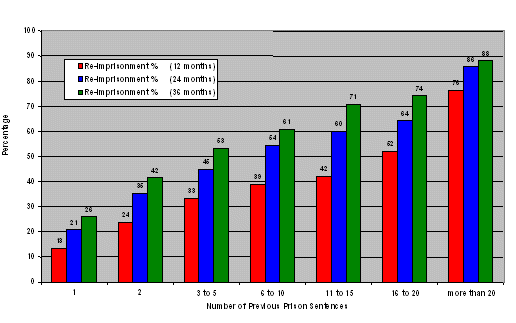
The following graph indicates how re-imprisonment rates vary according to the number of previous custodial sentences. Just one quarter of those who were released from their first term had been re-imprisoned by the three-years mark. In marked contrast, however, three-quarters of those who had served more than 15 prison sentences were back inside, as were an astonishing 88 percent of those who had previously served more than 20 sentences.
Table 9: Re-imprisonment Rate by Previous Prison Sentences (12, 24, 36 months Follow up)
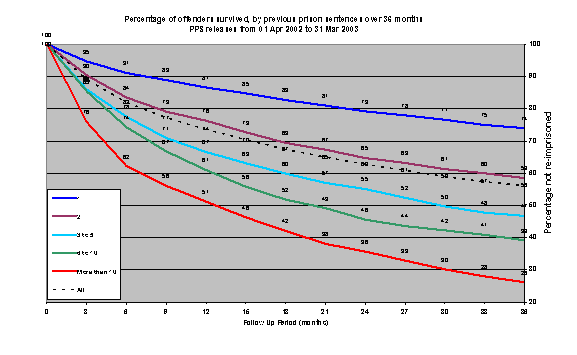
The survival curve for those who have previously served more than 10 such sentences is also very telling. The rate of return to prison is very rapid: almost one half are back in prison within 12 months.
Table 10: Percentage of offenders survived, by previous prison sentences over 36 months
Put together, these statistics form an interesting picture, suggesting that, each year, around one third of all offenders sent to prison go there for the first time. And of this group, when released, the majority - probably two-thirds or so - do not return. On the other hand, a much smaller proportion are almost endlessly cycling through a sequence of offending, conviction, imprisonment, release, and rapid return to further offending.
Reconviction by offence type
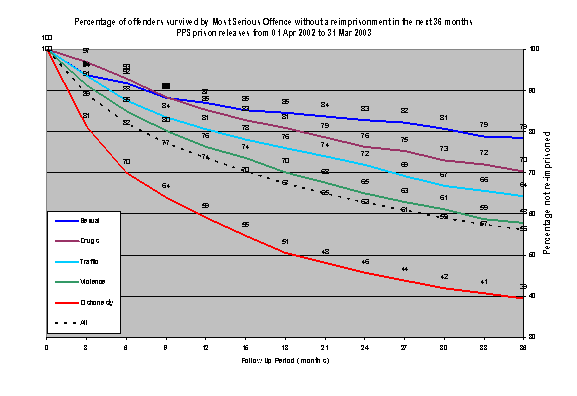
The following two graphs show reconviction rates by the most serious offence for which the offender had been sentenced. These clear reveal that re-imprisonment rates vary considerably between different types of offences: rates are highest among those who committed dishonesty offences (thefts, burglary, car conversion, etc) and lowest among those who were convicted of sexual offences.
Table 11: Reconviction and re-imprisonment rate by Most Serious Offence category (36 months follow-up)
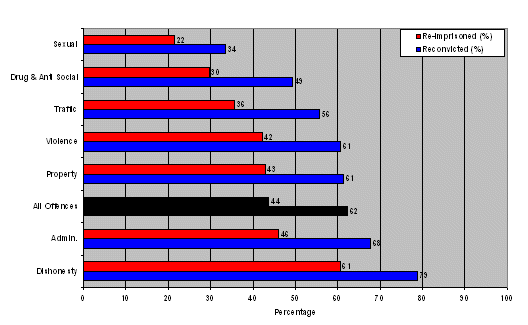
Table 12: Re-imprisonment rate by Most Serious Offence Class (36 months follow-up)
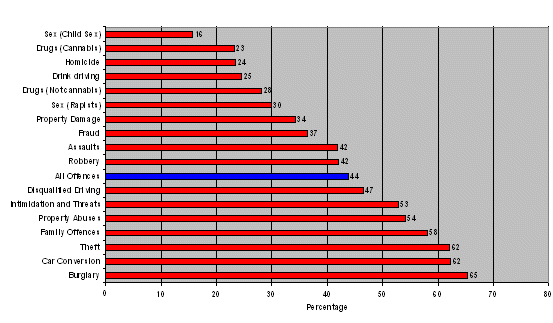
A number of interesting observations can be made when the sub-groups of offenders are examined in this way. While the rate of re-offending by all sex offenders is relatively low, child sex offenders are approximately half as likely to be re-imprisoned than are rapists. This is likely to reflect the fact that rape offenders tend to be more generally orientated towards criminal offending (of all types), which is less so for child sex offenders, a proportion of whom have convictions for no other types of offences. Similarly, while the overall rate of re-imprisonment for traffic offenders is around 36 percent, a significant difference emerges between drunk vs disqualified drivers, with the latter again being almost twice as likely to recidivate. Most striking however is the very high rates of re-imprisonment amongst the dishonesty offenders - those convicted of theft, car conversion and burglary. These are of course crimes with very high base-rates (in the sense that they form the bulk of all recorded crime), which means that those who tend to engage in such crimes probably do so, relatively speaking, with high frequency.
Once again, the survival curves reinforce this alarming picture of the behaviour of dishonesty offenders. Recidivism, when it occurs, tend to happen rapidly, with over 40 percent of these offenders back in prison for another offence within 12 months.
Table 13: Percentage of offenders survived by Most Serious Offence without a re-imprisonment in the next 36 months
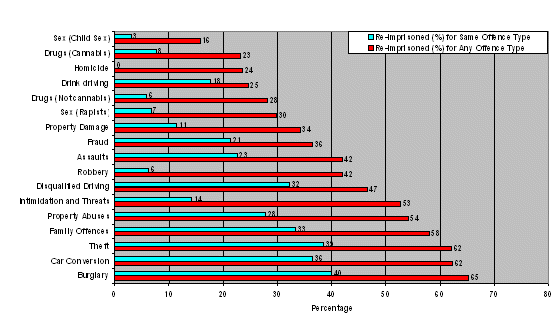
It is generally accepted, based on a wide range of studies, that most offenders do not "specialise" in any one type of offence: that is, the vast majority of persistent offenders have criminal histories featuring a sequence of convictions for offences across the criminal code. For example, many "violent offenders" will have histories in which a smaller number of convictions for violence are interspersed with large numbers of convictions for traffic offences, property offences, drug use, and so on. Tendencies towards specialisation do occur in some instances however. The following graph reports on the reconviction data for the current sample in a manner somewhat different to all of the other data in this report. Instead of counting any re-imprisonment during the follow-up period (where those re-imprisoned once and those re-imprisoned five times would still be counted once), the graph gives the re-imprisonment rates for the same class of offence at any time during the follow-up period.
The figures produced in this way indicate that only very small proportions of released robbery, drugs or sex offenders are re-imprisoned within 36 months for the same type of offence. There were no recorded instances of homicide offenders being re-imprisoned for another homicide offence within 36 months. However, once again a very different pattern emerges for the dishonesty offenders: fully 40% of released burglars were re-imprisoned at least once specifically for burglary, and a similar proportion of thieves for theft. Disqualified drivers also appear to be highly recidivistic with respect to this type of offending. Also of concern is the relatively high proportion of "family offenders" (mainly those guilty of domestic violence) who go on to commit further such offences.
Very low rates of reconviction for similar offences were recorded for sex offenders. As alluded to previously however, this cannot necessarily be interpreted as signifying that these offenders seldom go on to commit further such offences. Sex offences against children, in particular, have very low reporting rates. Even when a sex offence is resolved by Police, rates of conviction are relatively low. It is also the case that, with convicted sex offences, the length of time that tends to elapse, between the actual offence being committed and the offender's ultimate sentencing on that charge, can be several years. Thus the validity of the current analysis may well be improved by tracking patterns of reconvictions for sex offenders over longer periods of time.
Table 14: Re-imprisonment rate and new offence class (36 months follow-up)
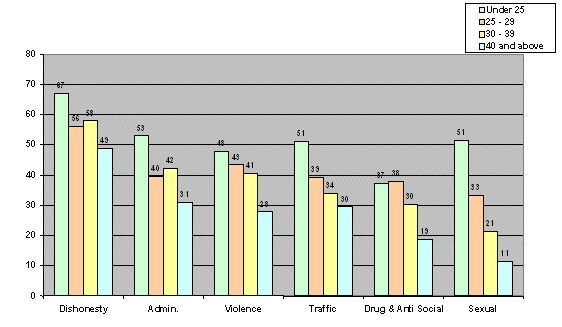
The following graph gives another perspective on re-imprisonment by offence type, by adding the age dimension. Among other things of note this indicates that sex offenders aged below 25 years have an unusually high rate of re-imprisonment.
Table 15: Re-imprisonment rate by Most Serious Offence type, age group (36 months follow-up)
Reconviction rates by risk score
The Department has, since 2001, assessed each offender using a sophisticated computerised risk measurement procedure known as "RoC*RoI" ("RoC" refers to risk of reconviction", "RoI" to "risk of re-imprisonment"). The process uses a range of variables 6 relating to each individual offender to calculate a score which indicates the relative probability that the offender will be re-imprisoned within the following five years 7.
A RoC*RoI score of 0.55 indicates a 55 percent likelihood of the offender being re-imprisoned within five years of release. Another way of expressing this would be that, of any sample of 100 offenders who shared the same score of 0.55, it could be expected that 55 of the 100 will be re-imprisoned at some time during the following five years.
The Department uses risk scores within its sentence management procedures primarily to determine prioritisation of offenders for key rehabilitative services, with the more intensive rehabilitative experiences reserved generally for high-risk offenders. It should be noted that in this context the term "risk" refers only to the probability of a re-imprisonment. A high score on the risk scale does not necessarily signify that any offence leading to a re-imprisonment will be a serious sexual or violent offence.
The current data record actual recidivism rates in relation to the risk scores of offenders. Table 16 below contains the percentages of offenders within each risk score decile band who were reconvicted and/or re-imprisoned within 12, 24 and 36 months. Note that the risk scores used here were calculated as at time of release in 2002/03. Thus, any subsequent reconvictions (as are reflected in the reconviction figures) do not contribute to individual risk scores used here.
Table 16: Re-imprisonment Rate by RoC*RoI (12, 24, 36 months Follow up)
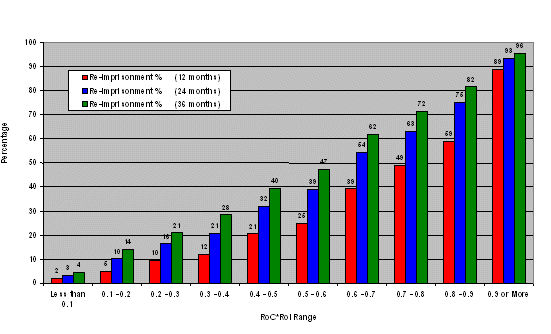
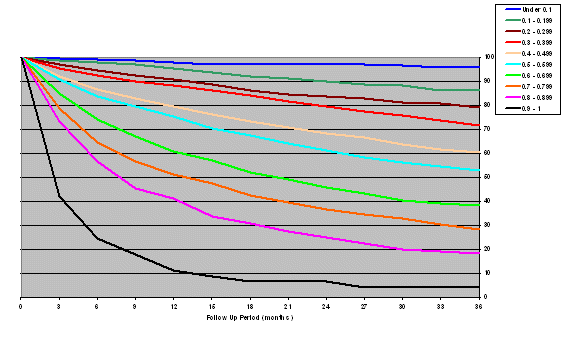
The graphed data shows an excellent level of correlation between risk score and re-imprisonment within the follow-up period. As such these figures provide a compelling validation of the Department's risk assessment methodology. Striking about the figures is the extraordinary alacrity with which offenders in the highest risk bands re-offend and are reconvicted. This is clearest in the following survival curve representation in Table 17 below, which shows that almost 90 percent of those in the highest risk band (>0.9) are returned to prison within 12 months.
Whereas the risk procedure purports to show the expected rates of re-imprisonment within five years, the highest-risk groups appear to be striking that level of re-imprisonment within two years. The procedure may thus be under-predicting the probability of re-imprisonment. This may reflect changes to the criminal justice processes over the past ten years: for example, steadily improving Police offence resolution rates may mean that an offender is more likely to be caught today than during the time period (circa 1990) from which were drawn the offending history details which underpins the risk assessment algorithm.
Table 17: Percentage of offenders, by RoC*RoI, survived without imprisonment in the next 36 months
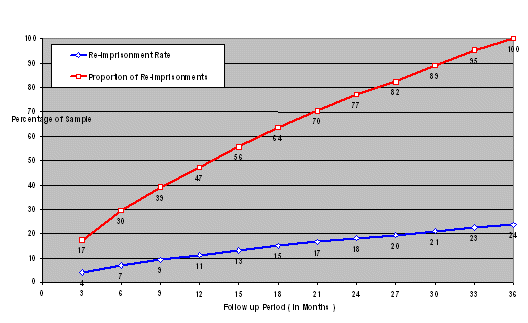
The following graphs (Table 18 and 19) simply group the data referred to in Table 17 by separating out those with risk scores above and below 0.5. For those in the lower-risk group, re-offending tended to occur gradually over the 36 months. For those in the higher-risk group, there is a tendency for there to be a surge of failures in the early months, and thereafter a gradual increase.
Table 18: The relationship between time and first re-offence (RoC*RoI 0.5 or more)
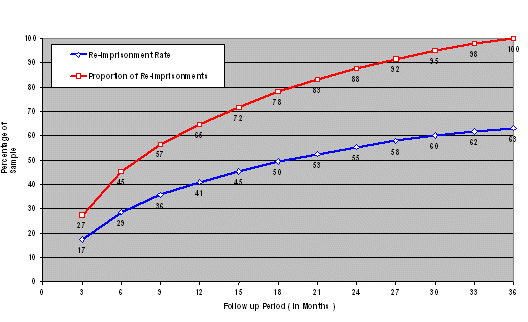
Table 19: The relationship between time and first re-offence, (RoC*RoI less than 0.5)
Reconviction rates: "first-timers and "recidivists"
The following section re-examines the entire re-imprisonment data set for the current sample by disaggregating offenders according to the number of previous prison terms. Those for whom their release in 2002/03 was from their first-ever prison term are designated in the following as "first-timers". The remainder, who had served two or more previous prison terms, are designated "recidivists".
The following figures give some indication of differences between these two sub-groups. Though median age is lower for the first-timers, who tend, not surprisingly, to include a larger number of young offenders, this group also includes a reasonably significant number of older (>40 years) offenders.
When looked at in terms of re-imprisonment rates, two features stand out: firstly, the overwhelming majority of young recidivists are returned to prison within 36 months. On the other hand, very few first-timers over the age of 40 were re-imprisoned.
Table 20: Prison releases (First-timers) by age group at release
Prison releases (Recidivists) by age group at release
Summary
For the 2002/03 prison release cohort, a number of important patterns show up in the re-imprisonment rates over the 36 months period for which data has been analysed. Many of these confirm already well-established precepts known about the criminal population: particularly that the highest rates of re-offending tend to occur amongst those who are younger, male, with a higher number of previous convictions and/or terms of imprisonment. Notable findings from this particular analysis include the inverse relationship between sentence length and re-imprisonment, despite age being ruled out as a factor, and the very high rates of both specialisation, and recidivism, amongst dishonesty offenders, particularly burglars. Further, the rapid speed with which offenders in the highest-risk are re-imprisoned is of great concern.
Finally, the analysis again validates the Department's risk assessment methodology (RoC*RoI), which should give confidence in its use within the various contexts in which it is currently employed.
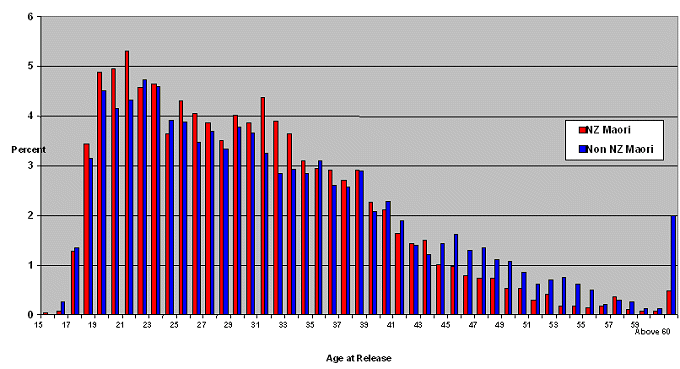
Appendix 1
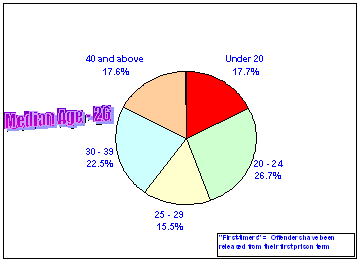
The Distribution of Age at Release, 2002/03
NZ Maori vs Non NZ Maori
Appendix 2: Counts of offenders in each sub-group
Re-imprisonment Rate by Age Group
| Age Group | Releases | Re-imprisoned | Re-imprisoned (%) |
|---|---|---|---|
Under 20 | 463 | 305 | 65.9 |
20 - 24 | 1093 | 562 | 51.4 |
25 - 29 | 925 | 427 | 46.2 |
30 - 34 | 843 | 353 | 41.9 |
35 - 39 | 658 | 246 | 37.4 |
40 and above | 873 | 257 | 29.4 |
Unknown | 90 | 18 | 20.0 |
All | 4945 | 2168 | 43.8 |
Re-imprisonment Rate by Gender
| Gender | Releases | Re-imprisoned | Re-imprisoned (%) |
|---|---|---|---|
Female | 313 | 84 | 26.8 |
Male | 4631 | 2083 | 45.0 |
Unknown | 1 | 1 | |
All | 4945 | 2168 | 43.8 |
Re-imprisonment Rate by Major Ethnicity
| Major Ethnicity | Releases | Re-imprisoned | Re-imprisoned (%) |
|---|---|---|---|
NZ Maori | 2679 | 1315 | 49.1 |
European | 1732 | 699 | 40.4 |
Pacific People | 424 | 137 | 32.3 |
Asian | 84 | 11 | 13.1 |
Other | 15 | 5 | - |
Unknown | 11 | 1 | - |
All | 4945 | 2168 | 43.8 |
Re-imprisonment Rate by Aggregate Sentence Length
| ASL | Releases | Re-imprisoned | Re-imprisoned (%) |
|---|---|---|---|
6 Months or Less | 1785 | 762 | 42.7 |
6 to 12 Months | 1135 | 546 | 48.1 |
1 to 2 Years | 899 | 436 | 48.5 |
2 to 3 Years | 457 | 192 | 42.0 |
3 to 5 Years | 367 | 129 | 35.1 |
More than 5 Years | 302 | 103 | 34.1 |
All | 4945 | 2168 | 43.8 |
Re-imprisonment Rate by Most Serious Offence Group
| MSO | Releases | Re-imprisoned | Re-imprisoned (%) |
|---|---|---|---|
Dishonesty | 1419 | 860 | 60.6 |
Admin. | 306 | 141 | 46.1 |
Property | 140 | 60 | 42.9 |
Violence | 1298 | 548 | 42.2 |
Traffic | 955 | 341 | 35.7 |
Drug & Anti Social | 482 | 143 | 29.7 |
Sexual | 331 | 71 | 21.5 |
Other Minor | 14 | 4 | - |
All | 4945 | 2168 | 43.8 |
Re-imprisonment Rate by RoC*RoI
| Risk Group | Releases | Re-imprisoned | Re-imprisoned (%) |
|---|---|---|---|
Less than 0.1 | 391 | 17 | 4.3 |
0.1 - 0.2 | 372 | 54 | 14.5 |
0.2 - 0.3 | 421 | 88 | 20.9 |
0.3 - 0.4 | 542 | 154 | 28.4 |
0.4 - 0.5 | 631 | 249 | 39.5 |
0.5 - 0.6 | 763 | 360 | 47.2 |
0.6 - 0.7 | 733 | 454 | 61.9 |
0.7 - 0.8 | 638 | 456 | 71.5 |
0.8 - 0.9 | 342 | 280 | 81.9 |
0.9 or More | 45 | 43 | 95.6 |
Unknown | 67 | 13 | 19.4 |
All | 4945 | 2168 | 43.8 |
Re-imprisonment Rate by Previous Prison Sentences
| Number of previous Prison Sentences | Releases | Re-imprisoned | Re-imprisoned (%) |
|---|---|---|---|
1 | 1784 | 464 | 26.0 |
2 | 853 | 354 | 41.5 |
3 to 5 | 1256 | 668 | 53.2 |
6 to 10 | 724 | 440 | 60.8 |
More than 10 | 328 | 242 | 73.8 |
All | 4945 | 2168 | 43.8 |
1 As a great many offenders are sent to prison for multiple offences, offenders in this analysis are grouped according to the "most serious offence" (MSO) for which they were imprisoned on the original sentence. MSO rankings are determined from the Ministry of Justice Seriousness of Offence Scale, which orders offences in accordance with the average number of days imprisonment ordered by judges, for that specific offence type, over the past five years.
2 Risk is measured by the RoC*RoI ("Risk of Reconviction/Risk of Re-imprisonment") methodology, which uses offender-related data - especially criminal history - to calculate an individual's likelihood of future reconviction.
3 The data set also included reconvictions on dates up to 30 June 2006 when the offence date was prior to 31 March 2006.
4 "Survival" data on these graph can be interpreted as follows: each data point along the curve indicates the percentage of offenders in the sub-group who had not been reconvicted at the point in time following release specified on the horizontal axis of the graph.
5 The length of sentence is based on the concept of the "aggregate sentence" - as noted above, many offenders are sent to prison after being convicted of multiple offences, and multiple sentences may be imposed. Some of these sentences may be concurrent, while others are cumulative. The "aggregate sentence" is the length of time calculated when all such sentences are combined. Depending on the length of the aggregate sentence, the offender will then (under the 2002 Sentencing and Parole Acts) serve between one-third and the entire term.
6 Variables used in calculation of individual risk scores include current age, gender, age at first conviction, number and seriousness of convictions, number and type of previous sentences, amount of time spent in custodial sentences.
7 For more information on the Department's risk assessment methodology, please refer to the publication Risk of Reconviction (1999) PDF, 923.6 KB