2.3 Sentencing
Similarly as for Police decisions to prosecute, a range of factors are taken into consideration, in this case by judges, when imposing sentence on convicted offenders. Most important perhaps are the seriousness of the current offence(s), the total volume of current offences for which the person stands convicted, previous offending history, responses to previous sentences, amenability to rehabilitation, and perceived risk to the community.
Analysis of the Ministry of Justice published figures on convictions and sentencing shows a consistent pattern of differences between the types of sentencing outcomes for all New Zealanders, for Europeans, and for Māori.
The sentence most frequently imposed by criminal courts in New Zealand is a monetary penalty. On the scale of sentence severity, fines are typically regarded as at the less severe end. Of all persons sentenced between 1996 and 2004, Māori typically received this sentence less frequently than did Europeans or other sections of the total population. It seems likely, however, that ability to pay, an obvious consideration in whether a fine is imposed, reduces the probability that Māori would receive monetary penalties, given the well-documented disparities in annual income between Māori and non-Māori 1.
Figure 3: Monetary sentences 1996-2004 by ethnicity (%)
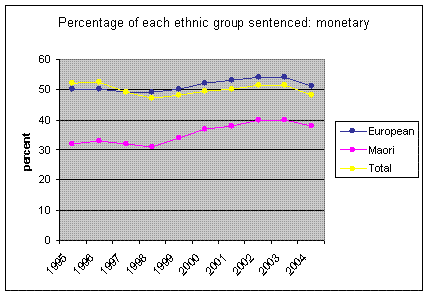
Ministry of Justice (2006) Conviction and Sentencing of Offenders in New Zealand:
1995-2004.
As the sentence severity scale is ascended however, the probabilities appear to reverse. Figure 4 shows that a greater percentage of Māori received some form of community-based sentence than did Europeans or others.
Figure 4: Community sentences 1996-2004 by ethnicity (%)
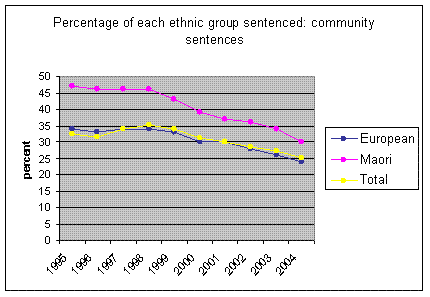
Ministry of Justice (2006) Conviction and Sentencing of Offenders in New Zealand: 1995-2004.
A similar difference occurs with the most severe penalty, imprisonment. Figure 5 below shows that, when sentenced, Māori were more likely to receive a prison sentence. Between 11% and 13% of convicted Māori receive sentences of imprisonment, as opposed to 7 - 9% of Europeans, a statistically significant difference.
Figure 5: Custodial sentences 1996-2004 by ethnicity (%)
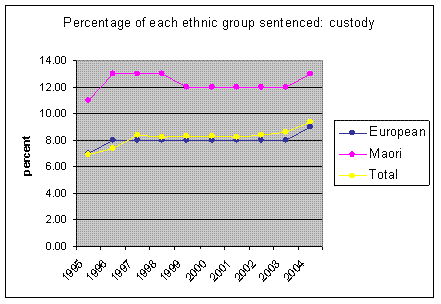
Ministry of Justice (2006) Conviction and Sentencing of Offenders in New Zealand: 1995-2004.
As noted in the introduction above, as a result of being sentenced in such numbers, Māori go on to make up 50% of the prison population at any one time. Figures on the types of offences for which Māori and non-Māori were imprisoned in 2005-2006 can be found in the Appendix (Figures 4.2, 4.3, and 4.4).
It is important to keep in mind that the preceding figures represent an analysis simply on the basis of ethnicity. More sophisticated multivariate analysis is required to control for other important factors such as seriousness of offence or offenders’ previous history, which then isolates the difference (if any) related solely to ethnicity, or some other unidentified factor associated with ethnicity. The Home Detention investigation reported in 2.4 below illustrates that much of what initially appears to be ethnic difference may be explained by other factors.
1 From 2006 Census: Median annual income for Europeans was $25,400, and for Maori $20,900. http://www.stats.govt.nz/NR/rdonlyres/FC6F9795-A534-45BC-97DF-F95FBE2C26E9/0/quickstatsaboutincomes.pdf. As well as lower median incomes, more Maori fall into the lower income groups – see figure 1, http://www.tpk.govt.nz/maori/work/personal.asp.