2.8 Prison sentenced snapshot trend by initial year convicted
For more details see: data source and enrichment methodology; data spreadsheet .
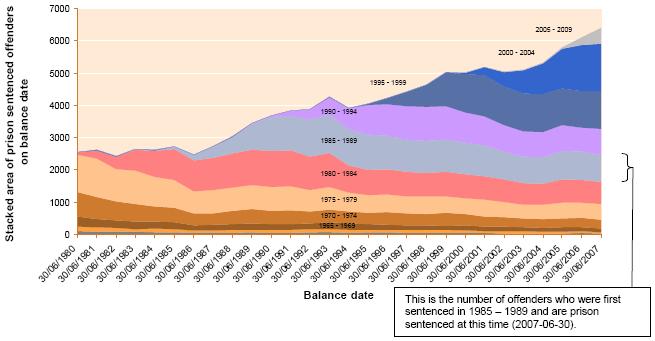
The graph above provides a breakdown of the sentenced prisoner population by the five year band during which prisoners recorded their first sentence (including convictions resulting in fines, discharges, disqualifications, so it includes sentences other than Corrections administered sentences). The colour differentiated strata from left to right should not be interpreted as meaning that the same offenders were in prison continuously. Each band signifies the number of beds occupied by offenders in a cohort, which will be made up of a changing and recirculating set of offenders.
Consistent with the age trends discussed in section 2.4, the graph above confirms the changing composition of the prisoner population, with a declining proportion of the population made up of those with only recent offending careers, and a tendency for persistence in the criminal careers of older offenders. For example, in 1980 almost 75% of the prisoner population had recorded their first conviction within the previous ten years of their incarceration. By 2005, this proportion had dropped to 41%.