8 Community sentenced throughput
8.1 Overview
The following section provides data on the number of "starts" of community-sentenced episodes in any given 12-month period from 1980. More detailed data is given for the June 2008 to July 2009 period. As with the snapshot data, the counting rules used here are based on each offender being allocated to a single management group on any one day even when they have concurrent but different sentence types. One major implication of this is that an offender "start" represents a transition from one major management status to another. This transition could be due to a new sentence being issued or the offender reverting to a lower status such as community work when a higher status management period like supervision is completed.
8.2 Community sentenced period starts per year trend by management group
For more details see: data source and enrichment methodology; data spreadsheet; major management category.
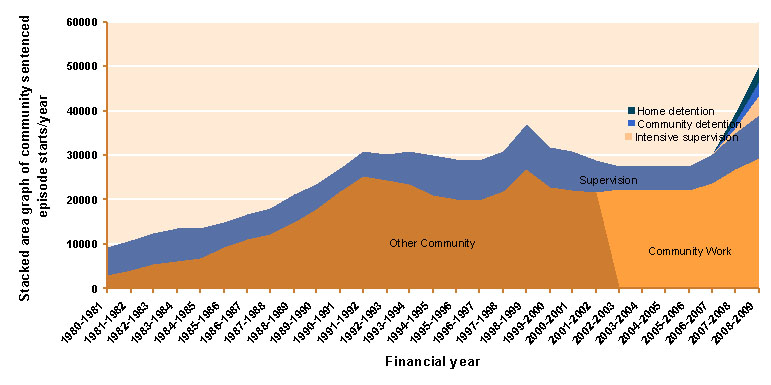
The graph above shows the number of "starts" of distinct episodes of community sentence management in each year. If an individual has several community sentences that are overlapping then this is treated as a single episode and so only a single episode start is counted. However if an individual has a period of remand in the middle of a single community sentence then the counting rules used here would count two distinct episodes of community sentence management separated by an episode of remand management.
The large spike apparent in community sentenced episode "starts" in 1998/99 resulted from significant numbers of fines defaulters being given community sentences during this period.
The impact of the new types of sentence (Home detention, Community detention, Intensive supervision) introduced in October 2007 can also be seen.
8.3 Community sentenced period starts per year trend by offence group
For more details see: data source and enrichment methodology; data spreadsheet; offence category.
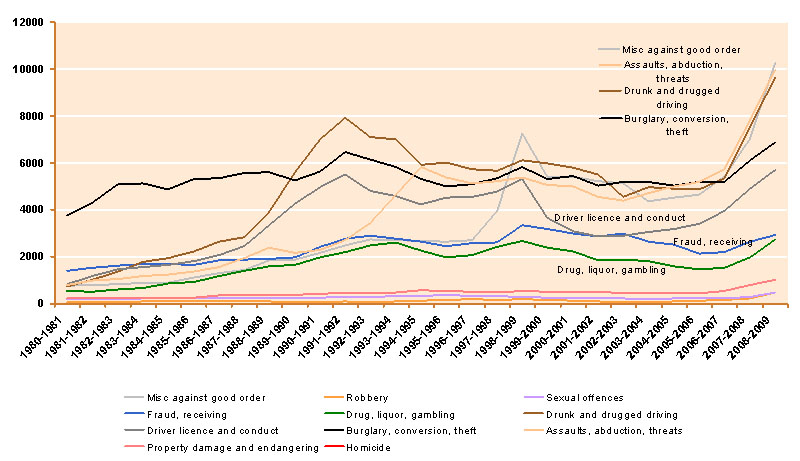
The large and sudden trend changes appearing above are likely to relate more to policy and criminal justice resource and process changes rather than to reflect sudden social change. For instance, the upward movement in numbers of assaults starting at the end of the 1980s relates to police process changes and increased reporting and focus on domestic violence. The peak in 1999 for "miscellaneous against good order" offences relates to fines defaulters being given community sentences at this time. The dramatic growth in the last two years results at least in part from an increase in police numbers combined with a new movement of fines defaulters into community sentenced offenders. A small part of this growth can also be attributed to diversion of short term prisoner candidates onto the new community sentences introduced in October 2007.
8.4 Community sentenced period starts per month trend by management group
For more details see: data source and enrichment methodology; data spreadsheet; major management category.
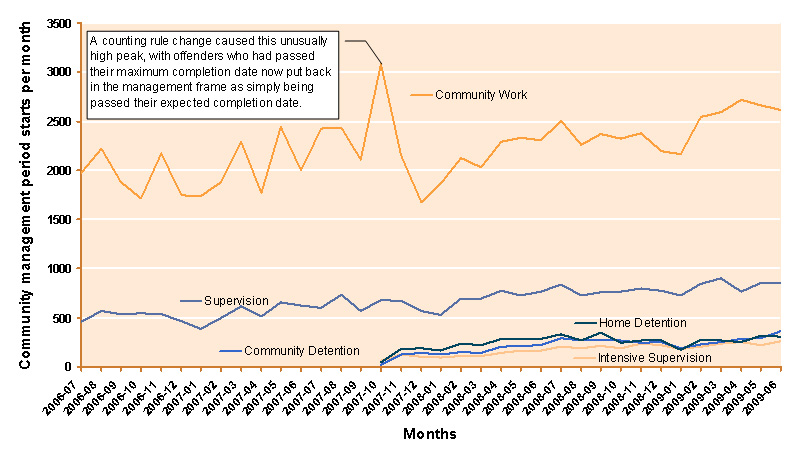
The graph above gives the recent trends in community sentence "starts" per month showing the introduction of the new community sentences. The numbers represented above are counts of offenders starting new major management periods due to a new sentence(s) being imposed or transitioning to a lower ranked major management period on completion of a sentence. Concurrent "supervision" and "community work" transitioning to just "community work" counts here as a "community work" period start. Reversion to previous or underlying status "restarts" account for typically 20% of all Community Work starts and 10% of all supervision starts.
The spike in community work "starts" in September 2007 results from a counting rule change, where offenders who had previously been considered beyond their "maximum completion date" and off management were re-designated as still under "community work" management (although beyond expected completion date) if an explicit completion record could not be found.
8.5 Community sentenced period starts duration imposed trend
For more details see: data source and enrichment methodology; data spreadsheet; major management category.
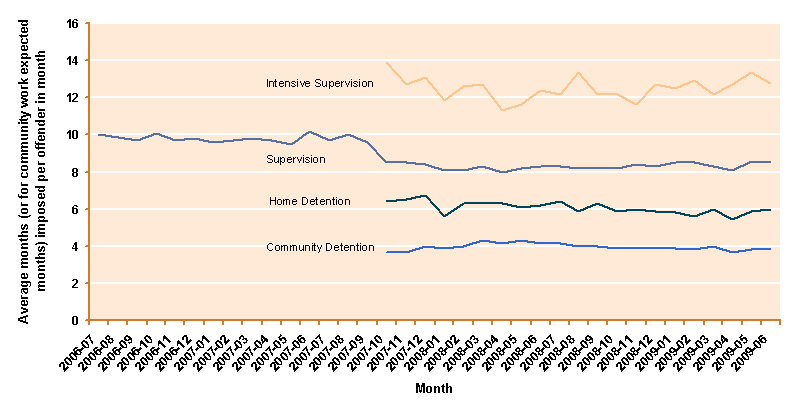
In the graph above, the trends in average months imposed are compared for the various community sentences. The average provided above is the average of new imposed durations where the sentences have not been issued concurrently with some more major sentence type. Where multiple sentences of similar type are imposed on the same person on the same day, they are treated as a single notional sentence. Where an existing sentence is being served and an extra sentence is added, these extension sentences have effectively been filtered out of the analysis. As a result of these filters the average durations shown above are not interchangeable with average durations calculated by other methods, but they still serve to show the relative durations imposed where the sentence type is the major sentence imposed on the day.