9 Offender Inventory
9.1 Overview
This section provides the offender inventory analysis for the 2008/2009 financial year. The earlier pages give balances, inflow and outflow data for each of the main classes of offenders managed: prison sentenced, remanded in custody, release ordered, community sentenced. The later pages give the overall balance sheet and summary of inflow and outflow transitions followed by analysis of the overall offender pool growth and circulation of offenders.
To enable this form of analysis, each offender's history has been simplified to a single timeline made up of the major management periods experienced, with enforcement of a one-day/one-status approach. In this system, and in order that analysis of transitions from one status to another can be usefully made, offenders subject to overlapping or concurrent forms of management are counted only once on any given date. As a consequence an individual offender described as transitioning from "Remand" status to "Community Work" status could result from either the remanded person being sentenced to start a new period of community work, or it might be that an individual already on community work was remanded in custody and then reverted to the original community work sentence (identifying the reason for the transition is not part of this report). This offender inventory and consequently the whole Offender Volumes Report describe "episodes" of management, rather than sentences. This means that the numbers in the current report may differ from those reported elsewhere by Corrections.
As noted earlier the offender inventory is analogous to a financial accounting or inventory management report. In financial accounting both cash flow and balance sheets are provided, while inventory management reports provide stock on hand and stock turn over. In the current report, offender flows and balances in the various management pools are detailed, such that the opening balance plus inflows less outflows equals the closing balance. In keeping with this inventory approach, offenders' status at year's commencement is carried forward from the previous year.
The number of transitions from one management group to another group gives an indication of the amount of work relating to the annual throughput. Given the different amounts of work associated with different forms of transition (for example, a new reception into prison vs. a transition from remand status to sentenced status) and knowing the volumes associated with the different transitions is useful management information.
9.2 2009 Restatement of historic balances
The 2007 version of this report brought to light some minor issues with the data extraction methodology. These are being fixed. The long term intention is to roll forward each offender status from day to day with the expectation that if small numbers of errors occur or there is data entry delay, then the status changes required will accrue to the period in which the data was corrected. However during the first few years the historic build of the offender volumes data set will periodically be revised as historical data issues are corrected. This has happened with the 2009 restatement (relative to 2007 version) of some offender histories and therefore any corrected offender status transitions have accrued direct to the historic period to which they relate. The impact of this has been relatively minor, with the balances at any given snapshot date in the 2007 report being slightly different from the current report. It is expected that future reports will move to an accrual process with only the occasional need to restate history if research demonstrates that the historical data can be substantially improved.
9.3 2007 Counting rule change
As explained in 7.2 "2007 Counting rule change for offenders on community work" there has been a change in the way Corrections counts offenders as being on Community Work managed muster. This year a major management category of Community Work includes offenders being managed beyond their expected completion date (previously regarded as a maximum completion date) and there has been considerable growth (5000 increase in two years) in the community work muster as a result.
9.4 Starts and completions of prison sentenced episodes
| Interpretation: This table shows the flow of offenders onto prison sentenced status and the status they came from: e.g. during the 2008/09 year, 125 people with parole transitioned onto long term prison sentenced status. Many of these were recalls to prison. |
Interpretation: This graph shows the balances that were prison sentenced at the start and end of the year: e.g. 6554 offenders were prison sentenced at 30/06/2009, of whom 679 had indeterminate term (life or preventive detention) sentences up from 631 at the beginning of the year. | |
Interpretation: This table shows the flow of offenders away from prison sentenced status to the status they went to next: e.g. 680 went from short term prison sentenced straight back onto remand. |
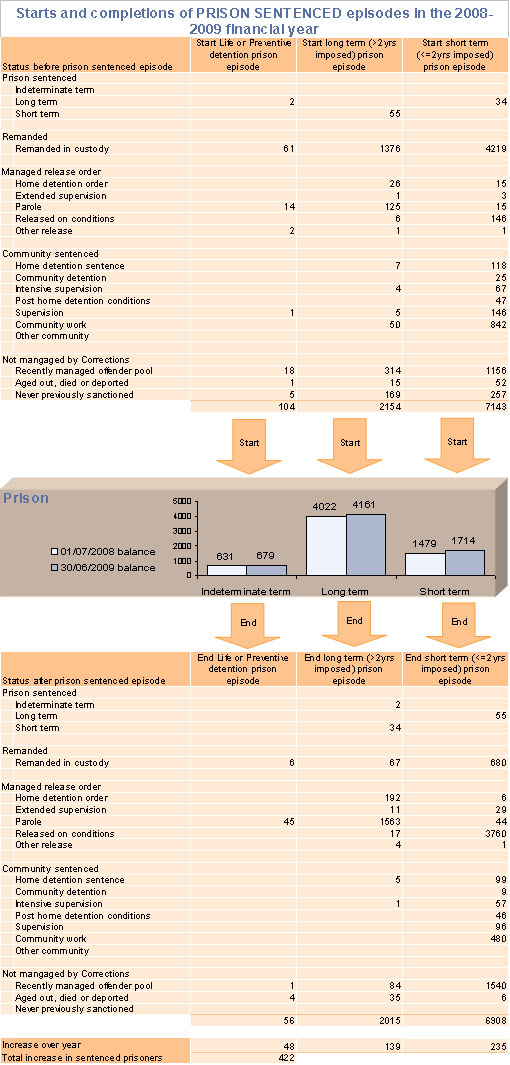
*Notes: Transitions may be due to offenders having new directives and orders or reverting to a lower management status at termination or expiry of the previous status. In a small number of cases the data is erroneous. However all transitions are included for completeness. For more details see: data source and enrichment methodology; data spreadsheet; major management category.
9.5 Starts and completions of remanded in custody episodes
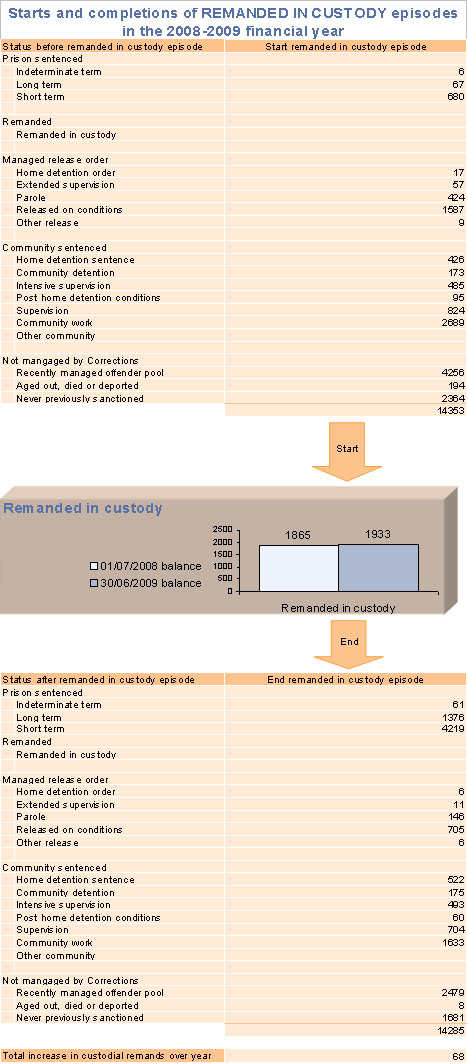
*Notes: Transitions may be due to offenders having new directives and orders or reverting to a lower management status at termination or expiry of the previous status. In a small number of cases the data is erroneous. However all transitions are included for completeness. For more details see: data source and enrichment methodology; data spreadsheet; major management category.
9.6 Starts and completions of release ordered episodes
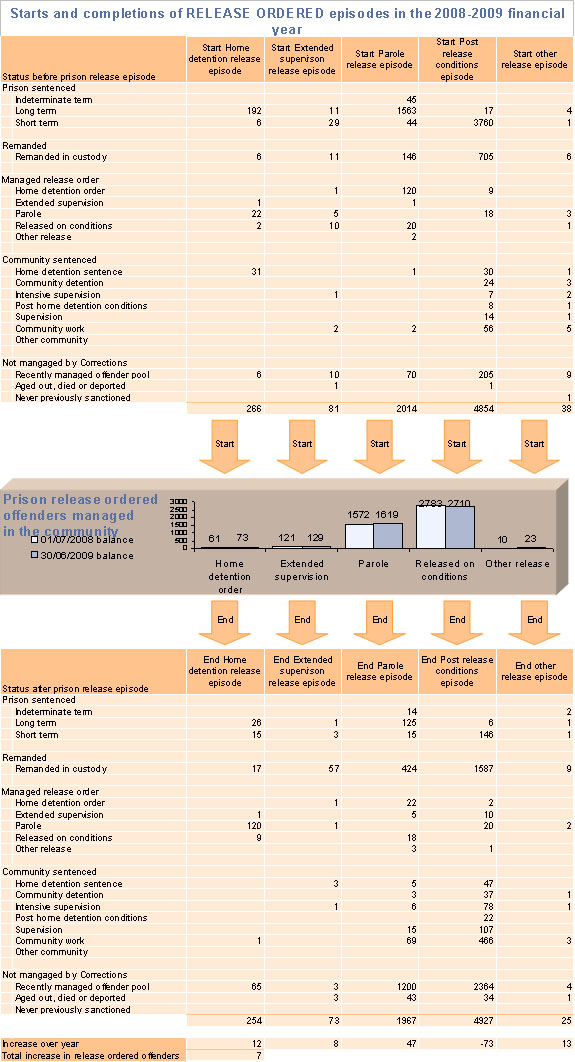
*Notes: Transitions may be due to offenders having new directives and orders or reverting to a lower management status at termination or expiry of the previous status. In a small number of cases the data is erroneous. However all transitions are included for completeness. For more details see: data source and enrichment methodology; data spreadsheet; major management category.
9.7 Starts and completions of community sentenced episodes
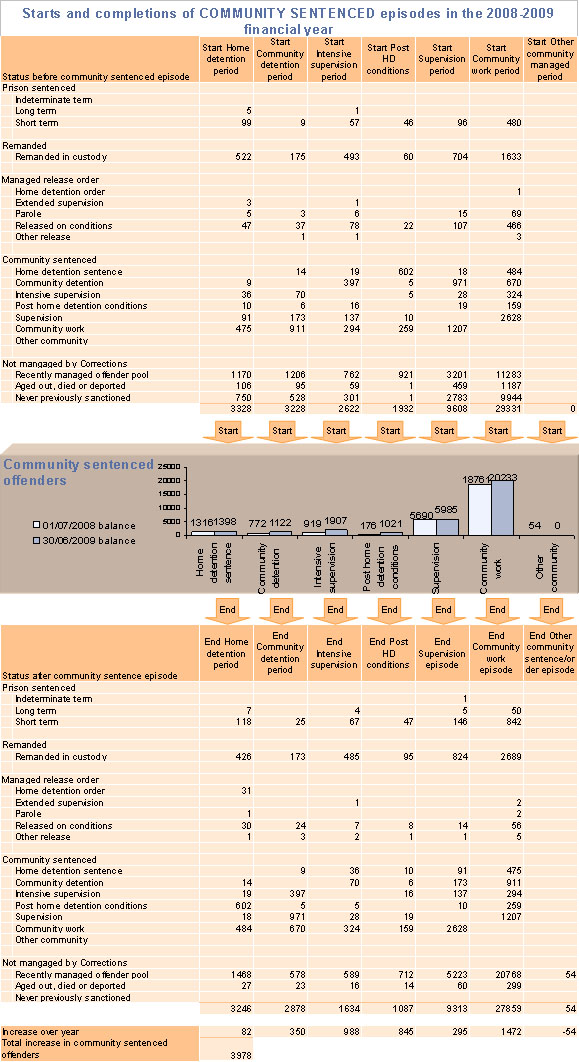
*Notes: Transitions may be due to offenders having new directives and orders or reverting to a lower management status at termination or expiry of the previous status. In a small number of cases the data is erroneous. However all transitions are included for completeness. For more details see: data source and enrichment methodology; data spreadsheet; major management category.
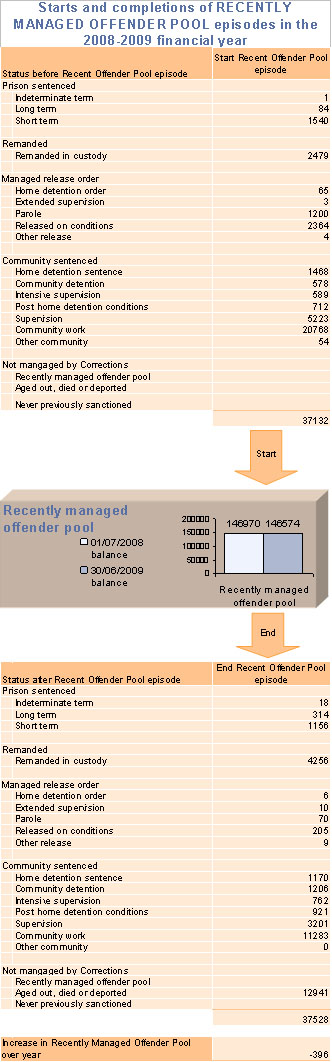
9.8 Starts and completions of recently managed offender pool episodes
| In order to provide for analysis of offender desistence and analysis of the prevalence of categories of such offenders in society, the concept of the "recently managed offender pool" has been developed. When an offender ceases to be managed by Corrections they are described in this analysis as released into the "recently managed offender pool" where they remain until they reoffend or age out. The term "recently managed offender pool" includes offenders that: - are not currently managed by Corrections - have been under a Corrections managed sanction within the last 10 years (remand is not included as a sanction) - are not recorded as deported or deceased. Examining the transitions into the offender pool provides information on Corrections final management regime before complete discharge. Examining the offender pool allows for one to ask for example: "how many recently active burglars are in the country and how does this compare with those currently under Corrections' management?". Examining the transitions from the offender pool to "aged out" status gives us an idea of offender desistence. |
*Notes: Transitions may be due to offenders having new directives and orders or reverting to a lower management status at termination or expiry of the previous status. In a small number of cases the data is erroneous. However all transitions are included for completeness. For more details see: data source and enrichment methodology; data spreadsheet; major management category. | |
9.9 Balance sheet
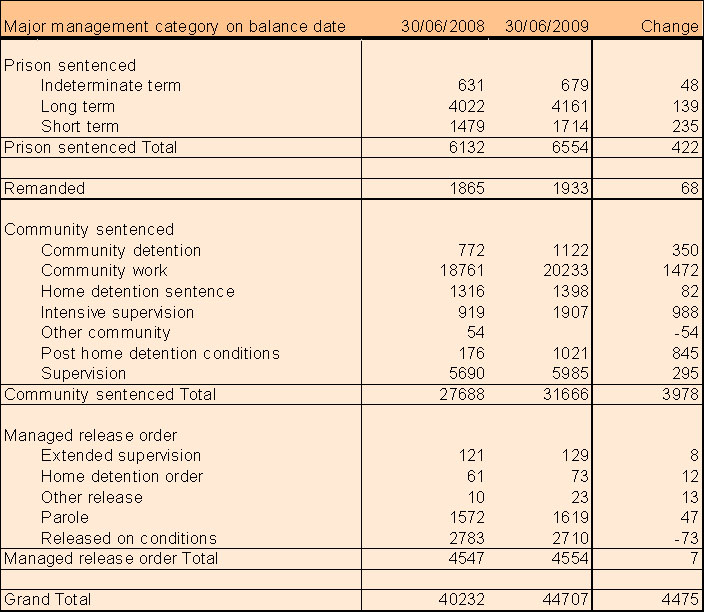
*Notes: Individuals are only counted once. Where an individual could be categorised with more than one status they are grouped with their status highest up the order in the above list. Status is based on records of directives and not manual muster records. In a small number of cases the data is erroneous however all available individuals are included for completeness.
For more details see: data source and enrichment methodology; data spreadsheet; major management category.
9.10 All major management transitions between categories of management
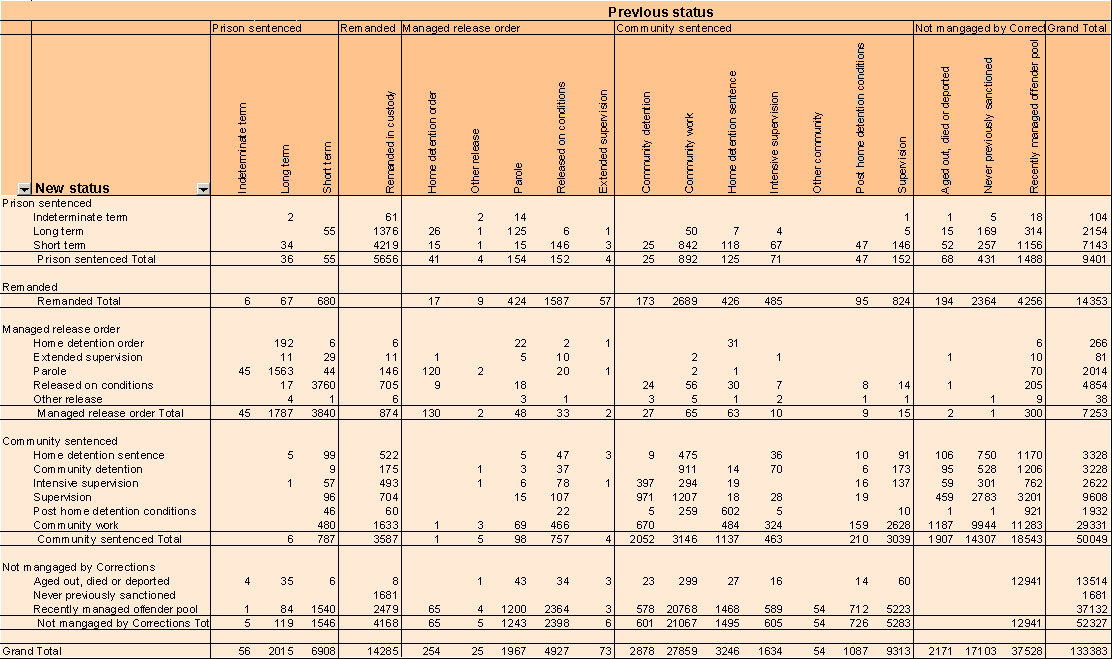
*Notes: Transitions may be due to offenders having new directives and orders or reverting to a lower management status at termination or expiry of the previous status. In a small number of cases the data is erroneous. However all transitions are included for completeness. For more details see: data source and enrichment methodology; data spreadsheet; major management category.
Reading across the page gives the number of people transitioning to the status listed on the left hand side, with the columns indicating the status people have come from. For example the "Remand" row shows 14353 episodes of remand were started and the "Remand" column shows 14285 episodes of remand were completed for a net increase of 68 remanded individuals overall.
9.11 Overall offender pool growth and circulation in 2008-2009 financial year
The table below and scale diagram provide the relative numbers of the recently active vs. currently managed offenders. Overall, new offenders and desisting offenders are reasonably closely matched meaning that total offenders have not changed much this year. Most of Corrections' new intake in the last year is drawn from the pool of known offenders seen within the previous ten years.
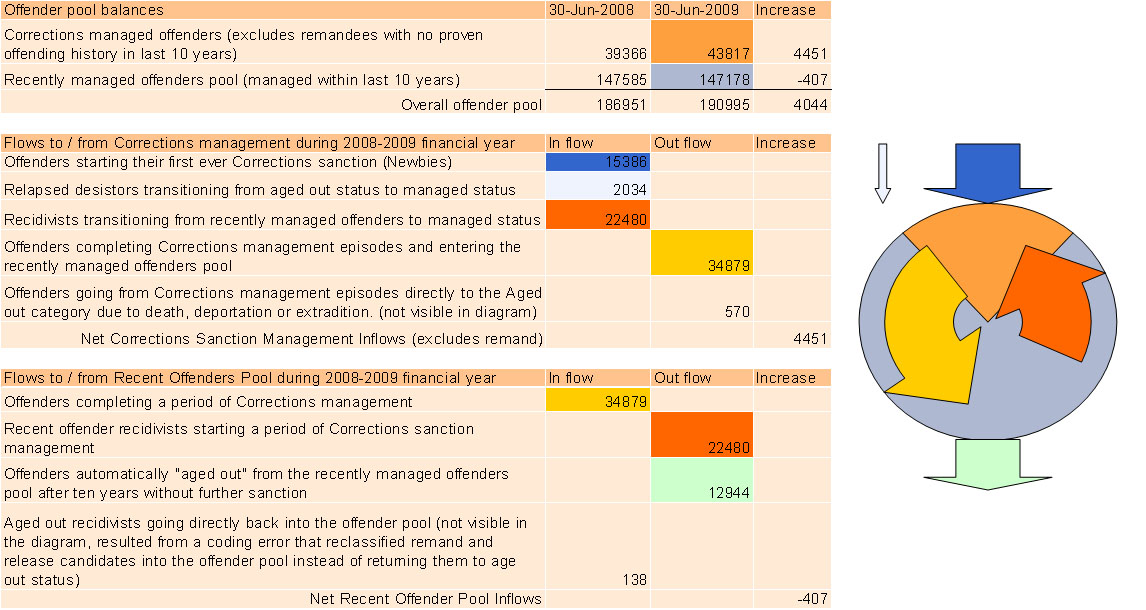
The diagram above depicts the pool of all offenders either under current management or recently managed. The relative size of the arrows overlaid on the chart show the proportionate throughputs of offenders from one category to another. It should be noted that the totals used here differ slightly from other pages in this report as the above totals include offenders in remand but reassigned appropriately as Corrections managed offenders or recently managed offenders on the basis their status immediately before the remand. For example someone on community work and then remanded would still be regarded as a Corrections managed offender, but someone remanded with no previous history would not be included in the above numbers.
9.12 Overall offender pool growth since 1980
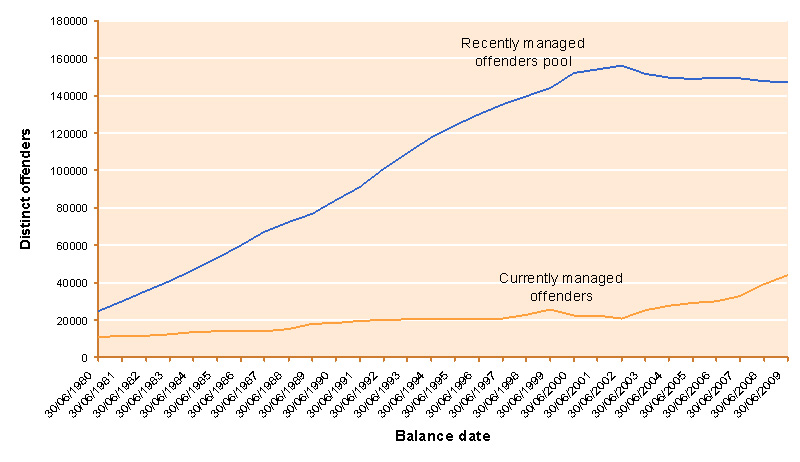
In the graph above, the "recently managed offenders pool" refers to the pool of offenders that on the balance date were not under Corrections sentence management but had been within the 10 years prior to that balance date. This provides a method for benchmarking active offenders, estimating the number of known new or recidivist offenders that are in circulation in the country at any one time. If offenders are known (by Corrections) to have died or have been deported they are removed from this pool. The historical data comes originally from the national "Law Enforcement System" that comprehensively recorded all sentences starting in 1976. In addition recidivist histories were back entered for some years after 1976 as the recidivists came to attention again. As there is no certainty around the back entry of data then the "recently managed offender pool" may under estimate numbers prior to 1986. The quality of the "recently managed offender pool" concept depends on the quality of the justice sector's offender identity management over the time span. The indications are that this underpinning identity management functionality has been consistently good. So the concept of the "recently managed offender pool" is robust. Interestingly it appears that the "recently managed offender pool" has stopped growing and that current growth is only in the numbers under Corrections' management.
Interpretation of the "recently managed offender pool" trend is difficult because a large number of those included at any one time will be offenders that are one time minor offenders from up to ten years ago mixed in with recidivists that have desisted and recidivists that are active.
Some possible explanations for the dramatic changes appearing above and requiring further investigation are listed below:
- Corrections are being directed to manage offenders for longer periods before they move to the recently managed offender pool.
- Recidivists are being rounded up more and more quickly so that a greater proportion of their time is spent under Corrections management.
- Social policies or conditions have been gaining traction and the rate at which new recidivist offenders are created has dropped off.
- We have had several decades of becoming more punitive but have reached a new steady state.
- We have become punitive enough that deterrence is quite suddenly working.