3 Prison sentenced throughput
3.1 Overview
This section counts the number of "starts" and "ends" of prison-sentenced episodes in the last year, in the context of previous 12-month periods back to 1980-81. Prison 'starts' and 'ends' counted here are similar to the usual counts of receptions and releases, but differ in certain ways. In particular, prison sentence episodes of zero duration (i.e., the sentence episode starts and finishes on the same day) are included. Such zero duration episodes can come about when time spent by an offender in custodial remand exceeds the sentence days to serve. Under these circumstances the offender is released immediately. However in this report the offender is still counted as having started a prison sentenced episode. Further, under pre-October 2007 legislation, some offenders with deferred sentence commencement dates were granted release on home detention by the Parole Board, effective immediately, thus avoiding time in prison. Technically, however, such cases constituted a sentence of imprisonment.
3.2 Prison sentenced period starts per year trend by management group
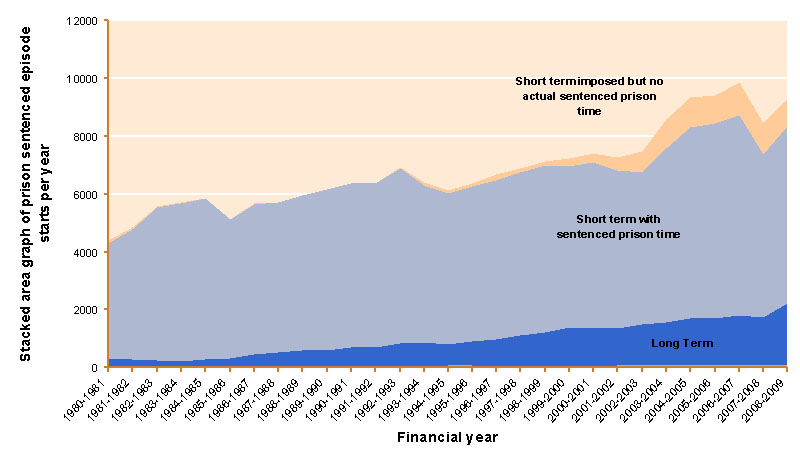
For more details see: data source and enrichment methodology; data spreadsheet; major management category.
The graph above indicates a drop in the numbers of sentences of imprisonment in the 2007-2008 year, relating almost entirely to short term sentences (<=2 years imposed). This drop corresponds with the introduction of new community sentences in October 2007, which specifically targeted this group. Of note, are the numbers who serve no time with a prison sentenced status, usually for the reasons discussed above. Also noteworthy is the large proportion (79%) of throughput that is short-term prison sentenced. This group typically occupies only 24% of prison beds. On the other hand, new starts of indeterminate (Life and Preventive Detention) sentences, though too few in number to show on the graph, currently make up 10% of prison sentenced offenders due to the accumulating numbers of such long stay prisoners..
3.3 Prison sentenced period starts per year trend by age at start
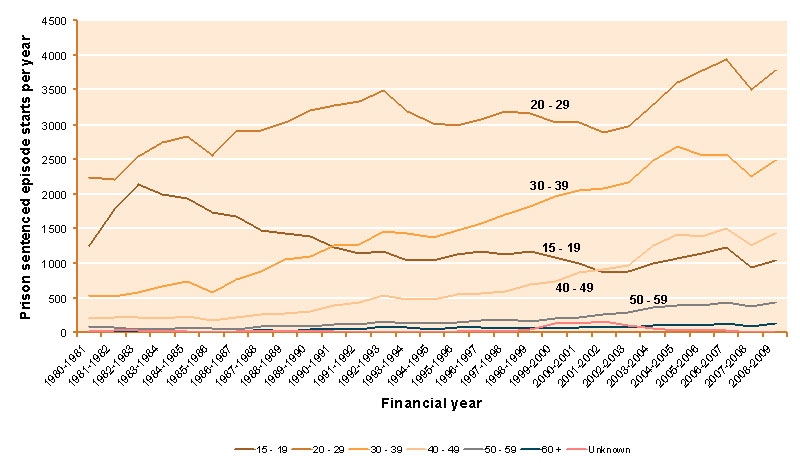
For more details see: data source and enrichment methodology; data spreadsheet.
3.4 Prison sentenced period starts per year trend by gender
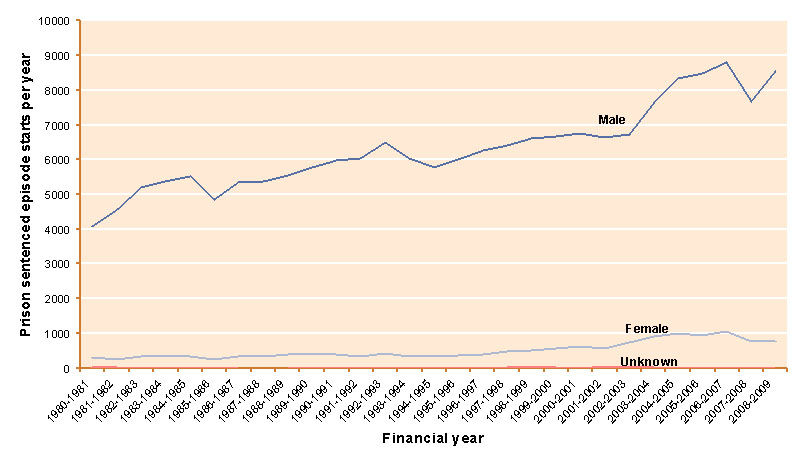
For more details see: data source and enrichment methodology; data spreadsheet.
3.5 Prison sentenced period starts per year trend by preferred ethnicity group
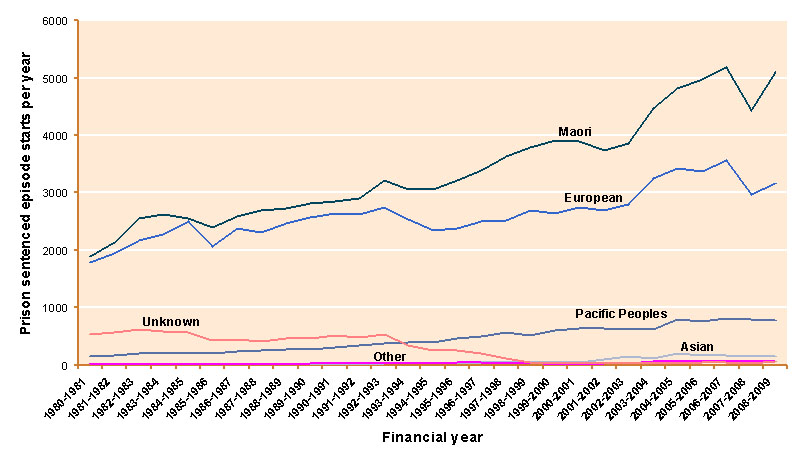
For more details see: data source and enrichment methodology; data spreadsheet; preferred ethnicity.
Interestingly, the drop in prison sentenced offender starts since the introduction of the new community sentences in October 2007 appears to have applied to Māori and European offenders but not to any marked extent in Pacific Peoples or Asians.
3.6 Prison sentenced period starts per year trend by offence group
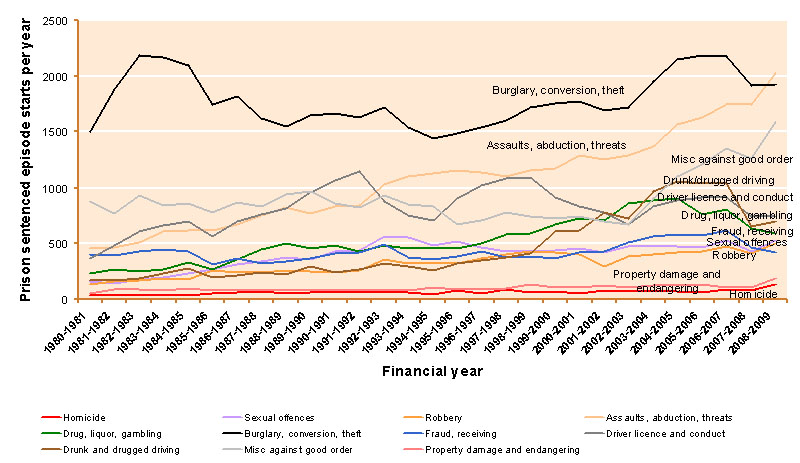
For more details see: data source and enrichment methodology; data spreadsheet; offence category.
The graph above indicates that the numbers of prison sentences started for "Burglary conversion and theft" constitute a large but relatively constant part of the reception and release workload over a thirty year period. However, steady and ongoing growth in the volumes of "Assaults, abduction and threats" can be observed over the last thirty years. Meanwhile the volumes of "Drug, liquor and gambling" starts appear to have peaked and recently have been declining. Also, the impact of the new community sentences introduced in October 2007 can be seen to have had varying impact on the different offence categories.
While the number of annual new starts for homicide indicated above is relatively low and relatively constant, the number of homicide offenders in prison (see 2.6 Prison sentenced snapshot trend by offence category) on any day is relatively more substantial and growing. Additionally, when new starts for sexual offences (shown above) and the build up of sexual offenders in prison (see 2.6 Prison sentenced snapshot trend by offence category) are considered, it indicates that while inflows of sexual offenders have been relatively constant since 1993, there has been a new trend to accumulate sexual offenders in prison for longer stays, since around 2002. This correlates with the introduction of the Parole Act 2002..
3.7 Prison sentenced period starts in 2008/09 by age at reception
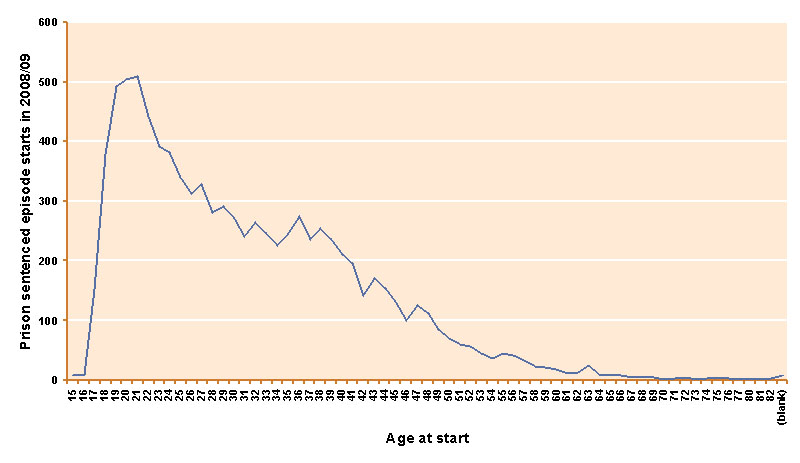
For more details see: data source and enrichment methodology; data spreadsheet.
3.8 Prison sentenced period starts in 2008/09 by prior major management category
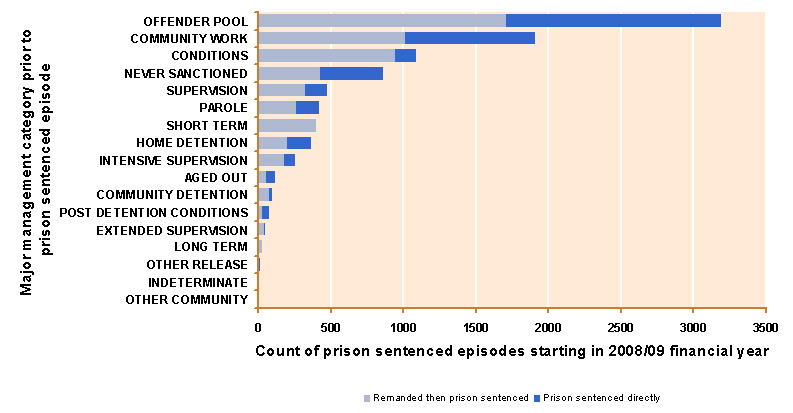
For more details see: data source and enrichment methodology; data spreadsheet; major management category.
The graph above indicates the management status of offenders prior to commencing terms of imprisonment during the 2008/09 year (or prior to remand if they were remanded first). The majority of prisoners were in custodial remand immediately prior to the commencement of their sentence. However a lesser proportion was on bail with the police or was not under any form of Corrections management. The data represented above indicate the large internal churn between categories of Corrections management, with some offenders moving from being prison sentenced, to remanded and back to prison sentenced without release. A relatively small proportion (9%) of prison sentenced new starts in the last financial year was for offenders who had no prior Corrections sanction.
Some of the transitions relate to offenders being recalled directly to prison from a prison release ordered category. This can happen at an order from the Parole Board when the offender has breached a condition of their release or committed further offending.
Explanations for all of the "major management categories" can be found by following the relevant link at the foot of the table.
3.9 Prison sentenced period ends in 2008/09 by following major management status
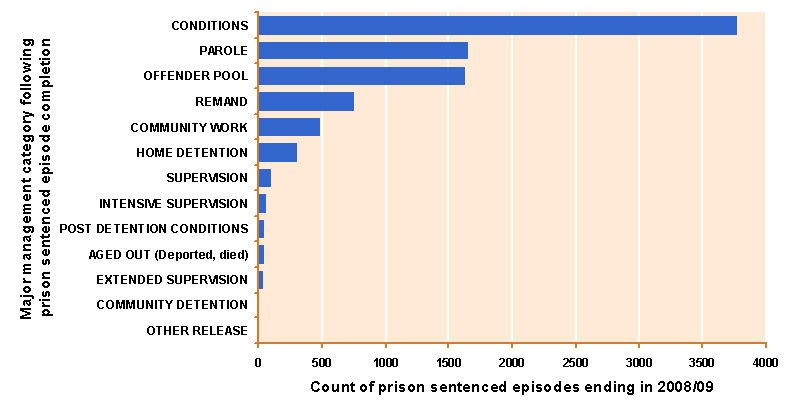
For more details see: data source and enrichment methodology; data spreadsheet; major management category.
The graph above shows that a significant number of offenders (8%) transitioned straight to a remand status after completion of their prison sentenced status in the 2008/2009 financial year. Only 18% of those completing a prison sentenced episode did not continue with some form of Corrections' management immediately afterwards.
3.10 Prison sentenced period ends in 2008/09 by actual months served
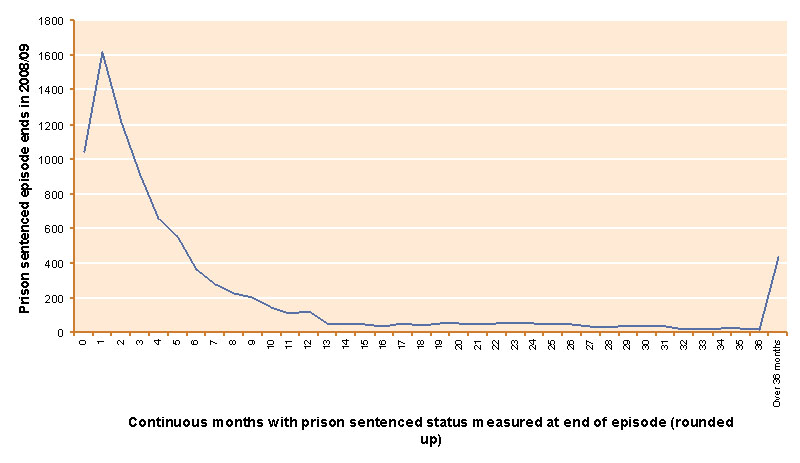
For more details see: data source and enrichment methodology; data spreadsheet.
In the graph above, a significant number of new starts are counted as having served zero months duration despite rounding the actual duration up. This can occur where an offender's remand time credited against the subsequently imposed sentence exceeds the required maximum time to serve, so the offender is released immediately upon sentencing having zero actual days with a prison sentenced status.
Clearly the majority of offenders ending prison sentences spent relatively short periods of time (less than six months) in prison as sentenced prisoners. Less than five percent of those released each year have spent more than three years in prison.