3.2 Prison sentenced starts per year trend by management group
For more details see: data source and enrichment methodology; data spreadsheet ; major management category.
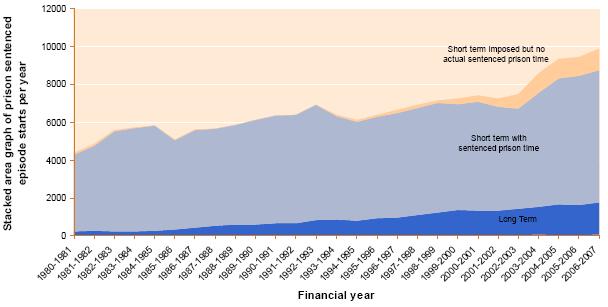
The graph above indicates the recent growth in numbers of sentences of imprisonment. Of note is the number who serve no time with a prison sentenced status, usually for the reasons discussed above. Also noteworthy is the large proportion and significant growth in the number of offenders short-term prison sentenced. On the other hand, new starts of indeterminate (Life and Preventive Detention) sentences, though too few in number to show on the graph, currently make up 9% of prison sentenced offenders, due to the extended time spent in prison.