12 Offender timeline examples
The previous section described the reduction of the source data into a single timeline of distinct non overlapping periods of management for each offender. A graphical representation of an example timeline was then given. Using this graphical representation it now becomes possible to describe the complex cross section of offenders that Corrections deal with on a daily basis in terms of the directions made for them.
The timelines below describe individual offenders starting (or completing) episodes of Corrections management on a typical day (one line per offender). The timelines show an offender life from birth until recently from a Correction's perspective, ordered from youngest to oldest.
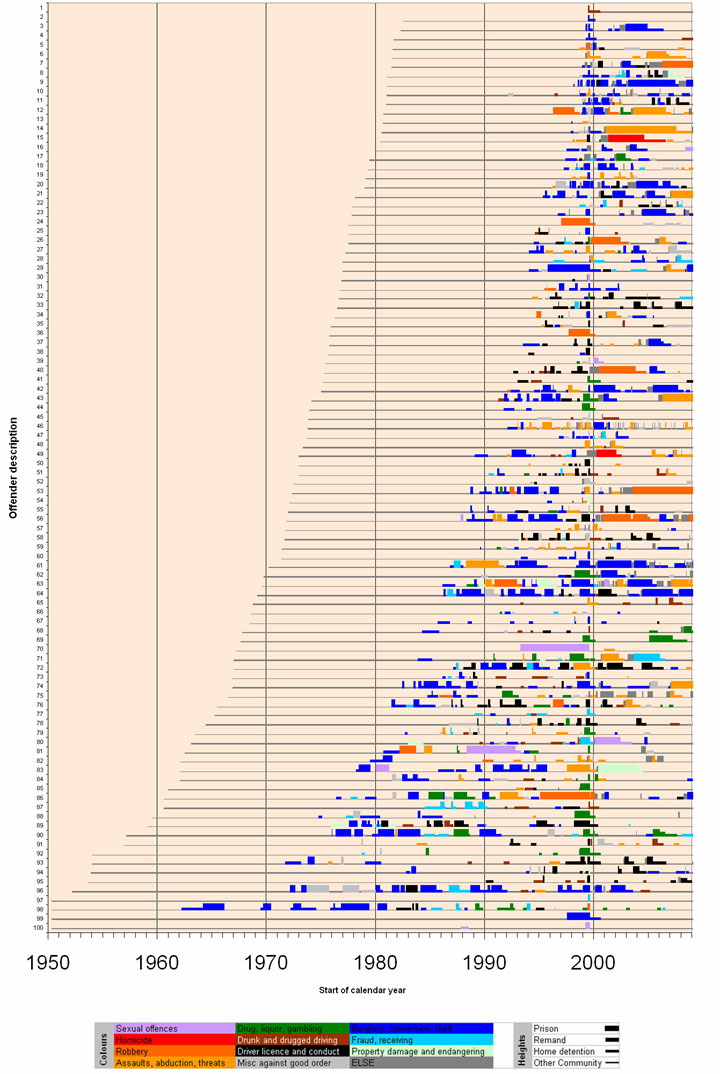
12.1 Prison sentenced starts workload for an example day in 2009
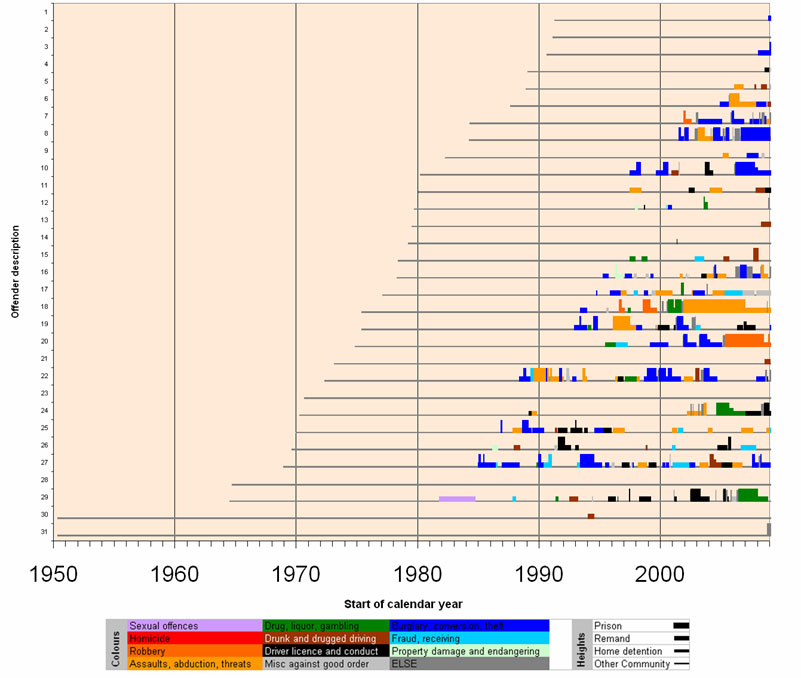
Each horizontal line on the chart represents a single offender from birth until recently and shows the offender's episodes under Corrections' management. The collection of "timelines" above is a cohort of offenders from a single typical days Corrections' workload
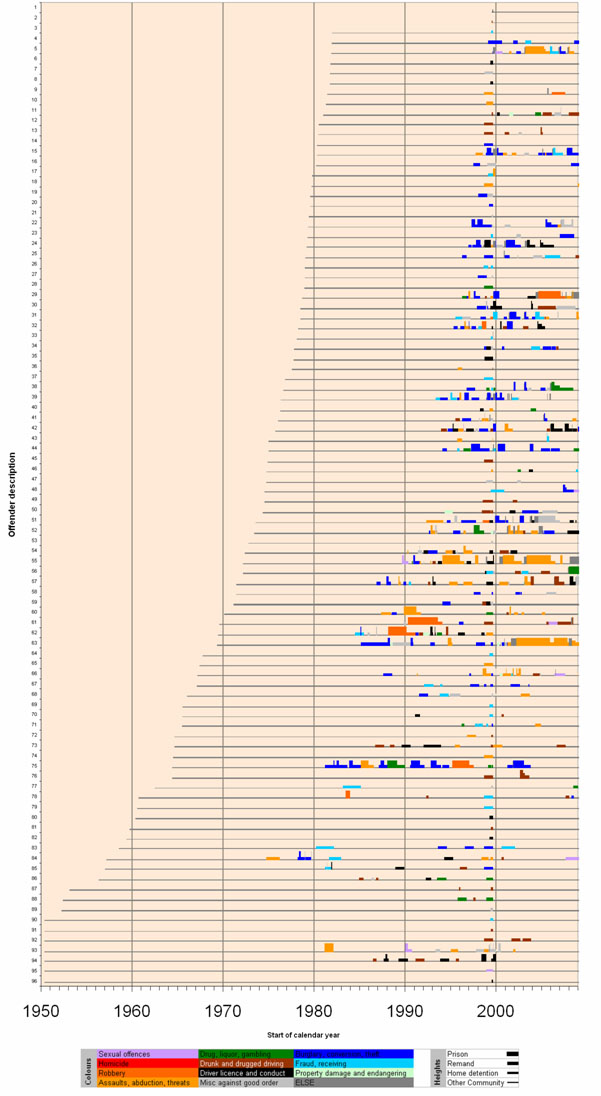
12.2 Remand starts workload for an example day in 2009
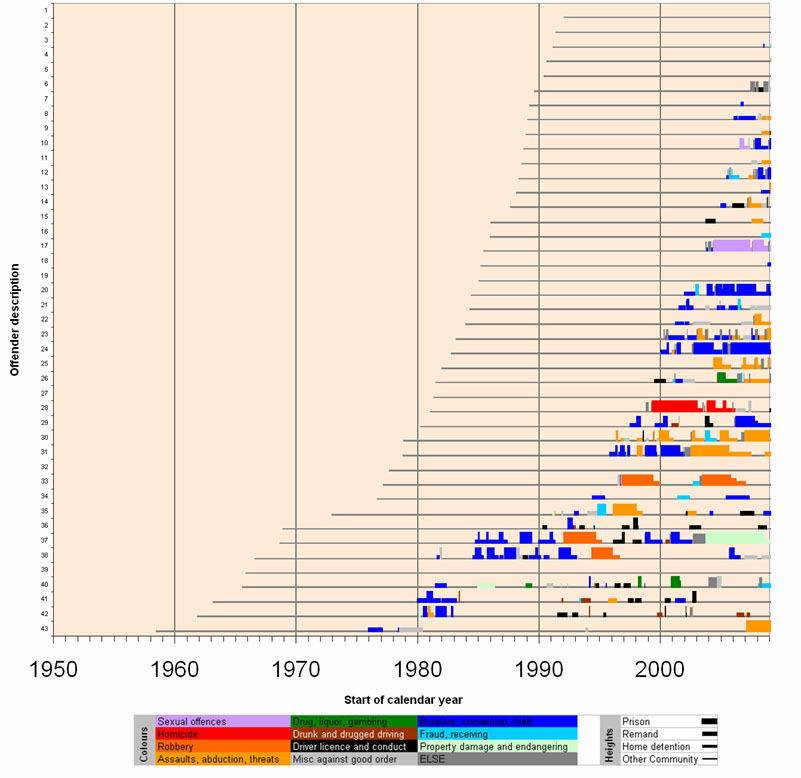
Each horizontal line on the chart represents a single offender from birth until recently and shows the offender's episodes under Corrections' management. The collection of "timelines" above is a cohort of offenders from a single typical days Corrections' workload
12.3 Community work starts workload for an example day in 2009
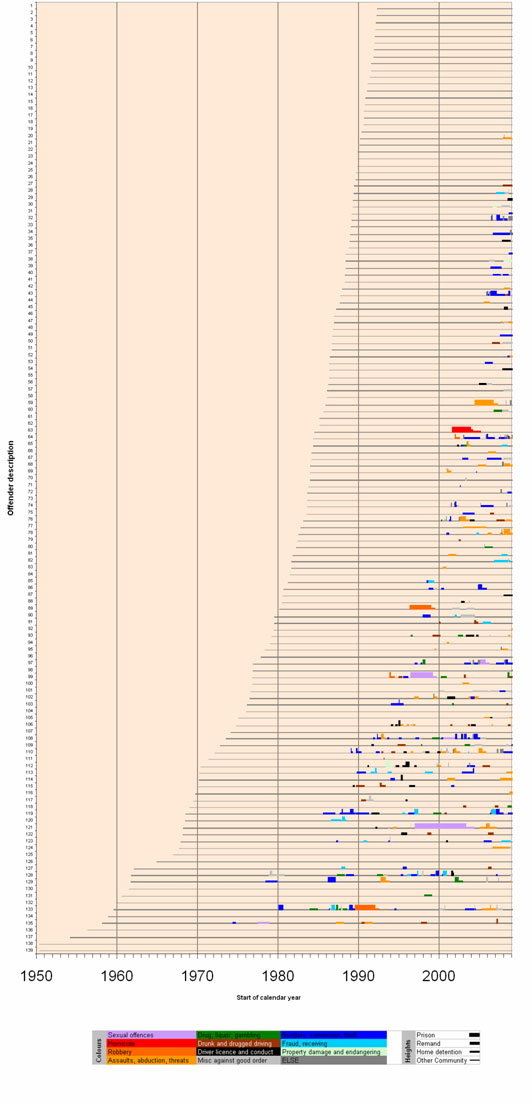
Each horizontal line on the chart represents a single offender from birth until recently and shows the offender's episodes under Corrections' management. The collection of "timelines" above is a cohort of offenders from a single typical days Corrections' workload
12.4 Community sentence (non CW) starts workload for an example day in 2009
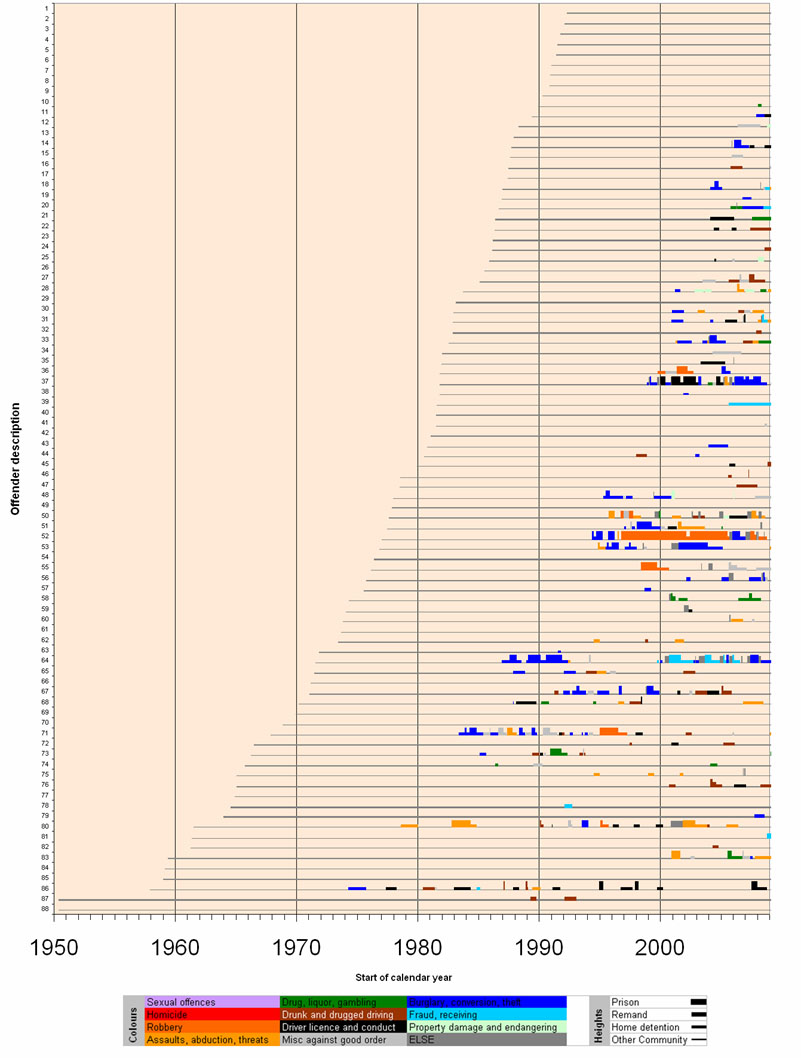
Each horizontal line on the chart represents a single offender from birth until recently and shows the offender's episodes under Corrections' management. The collection of "timelines" above is a cohort of offenders from a single typical days Corrections' workload
12.5 Prison sentence releases workload for an example week in 1999
Showing Corrections' management before 1999 and the 10 years since release.
Each horizontal line on the chart represents a single offender from birth until recently and shows the offender's episodes under Corrections' management. The collection of "timelines" above is a cohort of offenders from one typical week's workload in 1999
12.6 Community sentence episode ends workload for an example day in 1999
Each horizontal line on the chart represents a single offender from birth until recently and shows the offender's episodes under Corrections' management. The collection of "timelines" above is a cohort of offenders from a single typical days Corrections' workload