11 Offender timeline examples
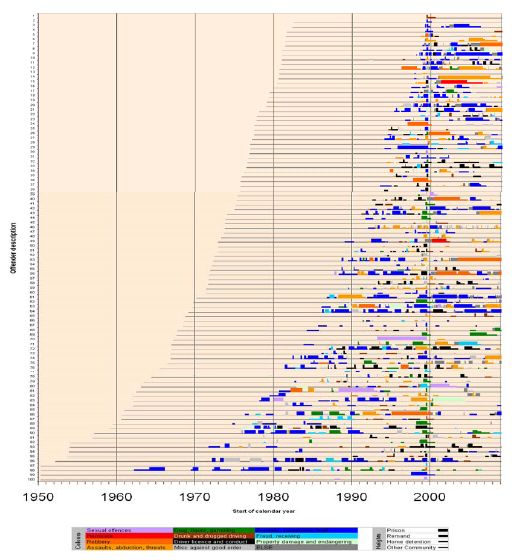
The previous section described the reduction of the source data into a single timeline of distinct non-overlapping periods of management for each individual. A graphical representation of a timeline can be created. Using this graphical representation it is now possible to visualise the life-course patterns of individuals that the Department of Corrections manages on a daily basis, in terms of the directives made for them.
The timelines below represent individual prisoners starting (or completing) episodes of Corrections’ management on a typical day (one line per prisoner). The timelines show offenders from birth until recently from a Department of Corrections’ perspective, ordered from youngest to oldest. Each horizontal line on the chart represents a single offender. Each of the vertical lines represents the start of a new decade.
11.1 Prison sentenced episode starts workload for an example day in 2009
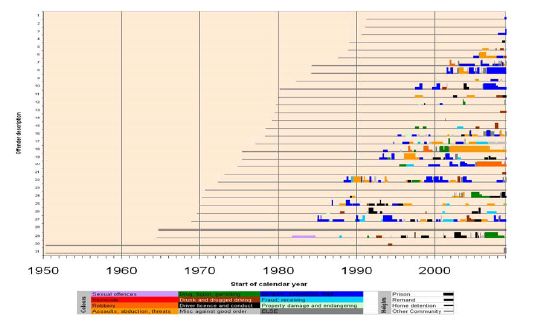
The collection of timelines above is a cohort of newly sentenced prisoners from a single typical day in the Department of Corrections’ workload.
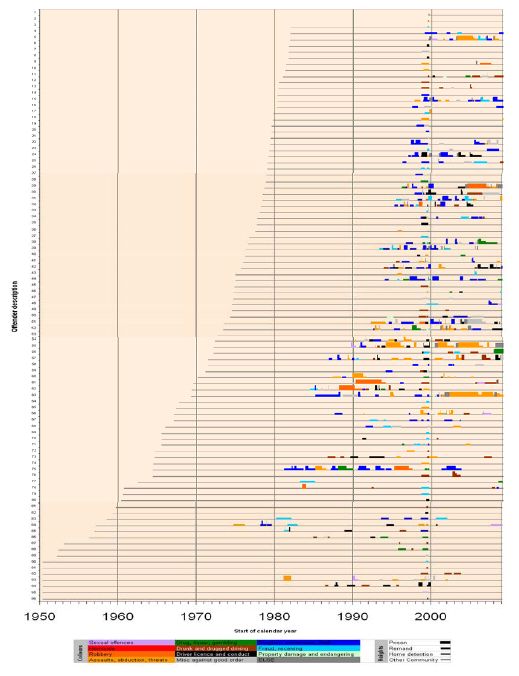
11.2 Remand episode starts workload for an example day in 2009
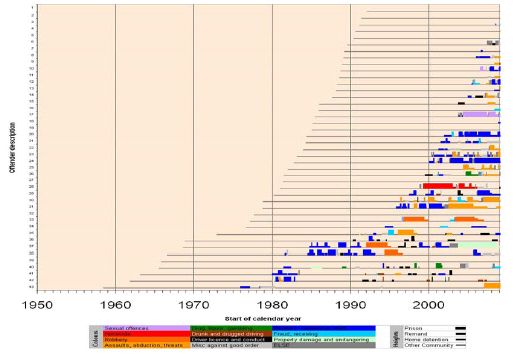
The collection of timelines above is a cohort of new remand prisoners from a single typical day in the Department of Corrections’ workload.
11.3 Community work episode starts workload for an example day in 2009
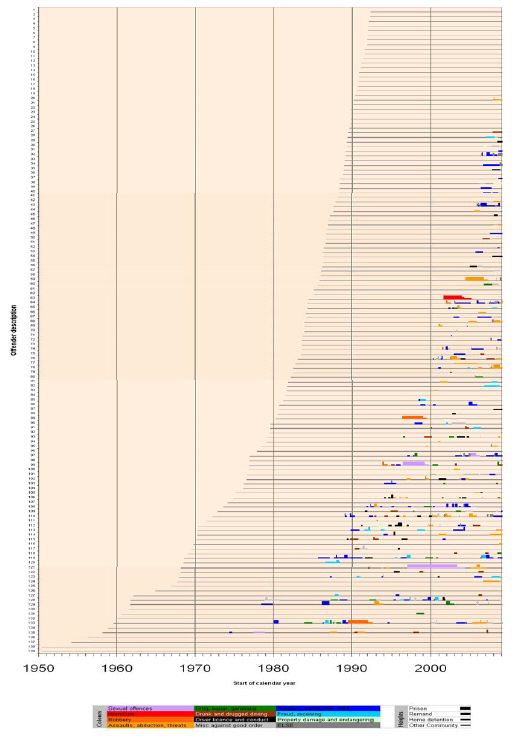
The collection of timelines above is a cohort of offenders with a new community work sentence from a single typical day in the Department of Corrections’ workload.
11.4 Community sentence (non CW) episode starts workload for an example day in 2009
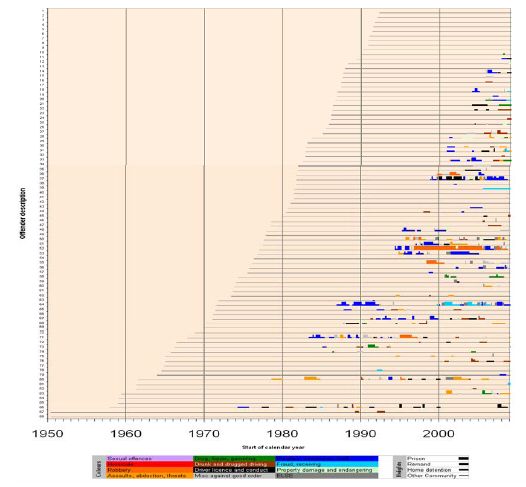
The collection of timelines above is a cohort of offenders with a new community sentence from a single typical day in the Department of Corrections’ workload.
11.5 Prison sentence releases workload for an example week in 1999
The figure shows the Department of Corrections’ management before 1999 and the 10 years since release for a cohort of offenders released from prison in 1999 during one typical week.
11.6 Community sentence episode ends workload for an example day in 1999
The figure shows the Department of Corrections’ management before 1999 and the 10 years since community sentence completion for a cohort completing sentences on a typical day in 1999.