6 Prison remand throughput
6.1 Overview
The information on remand throughput shows the periods of custody where a prisoner has maintained a remand status, even where charges have changed during the period. Individual prisoners may, in the course of a single year, have multiple remand episodes, relating either to a single charge (or set of charges), or to successive charges.
Remanded in custody starts occur in greater numbers than sentenced receptions to prison.
6.2 Remand episode starts — overall trend
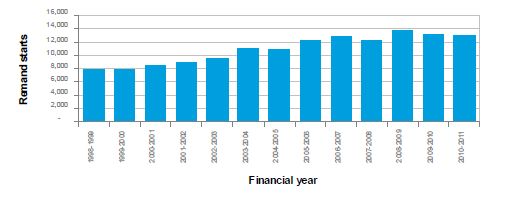
For more details see: Data Spreadsheet
6.3 Remand episode starts — gender
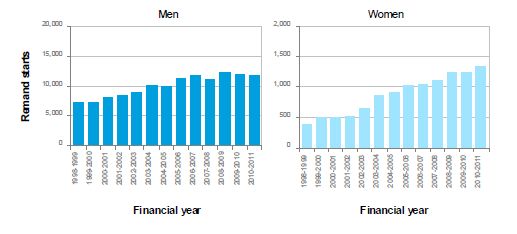
For more details see: Data Spreadsheet, Gender - 12 Data definitions and groupings
6.4 Remand episode starts — age
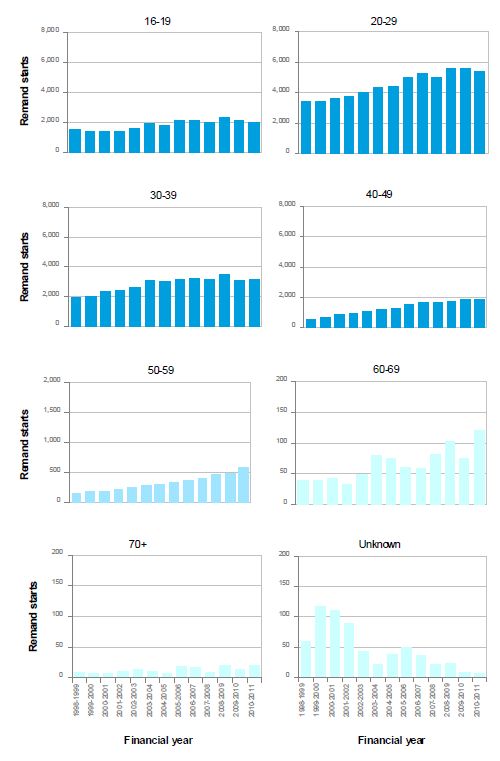
For more details see: Data Spreadsheet, Age - 12 Data definitions and groupings
6.5 Remand episode starts — ethnicity
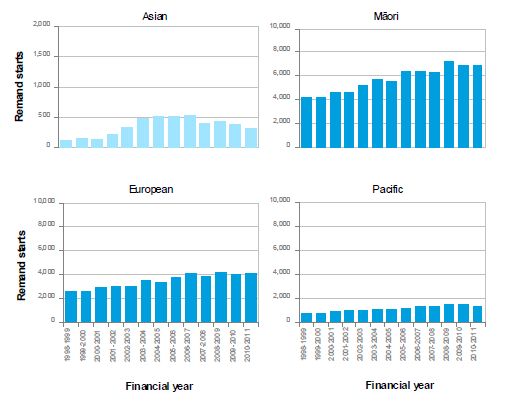
For more details see: Data Spreadsheet, Ethnicity - 12 Data definitions and groupings
6.6 Remand episode starts — offence group (as charged)
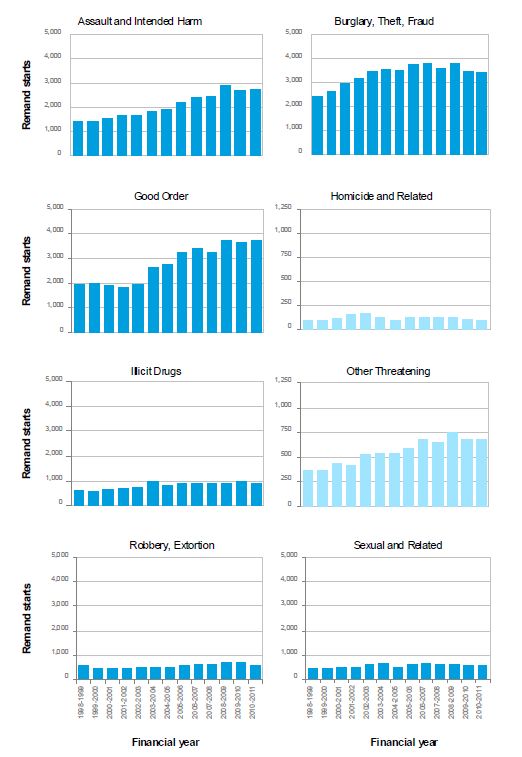
For more details see: Data Spreadsheet, Offence grouping - 12 Data definitions and groupings
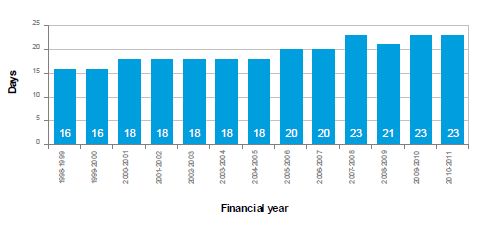
6.7 Median duration at completion (in days)
For more details see: Data Spreadsheet
There has been an increase in the median number of days a prisoner has spent on remand. Note that the median stay of those currently remanded (see figure 5.7 Median length of stay to date (in days) exceeds the median stay of those exiting from remand shown above. This is because those prisoners who remain on remand are not included in the figure above.
6.8 Remand episode ends — duration at completion in 2010/11 (in weeks)
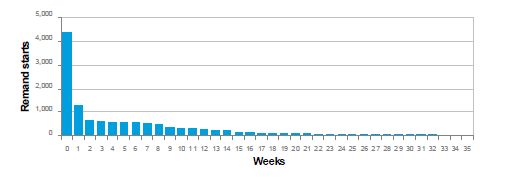
For more details see: Data Spreadsheet
The figure above shows that around 1,700 remand prisoners ended their remand episode within one week of reception.
6.9 Remand episode ends — cumulative percentage released in 2010/11 (in weeks)
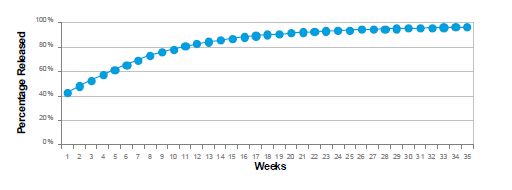
For more details see: Data Spreadsheet
Around 50 percent of remand episodes end within one month. By eight weeks around 77 percent of remand episodes have ended.
6.10 Remand episode starts — age in 2010/11
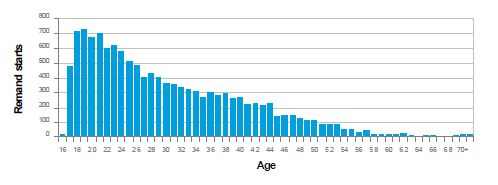
For more details see: Data Spreadsheet, Age - 12 Data definitions and groupings
6.11 Remand episode starts — immediate prior management category in 2010/11
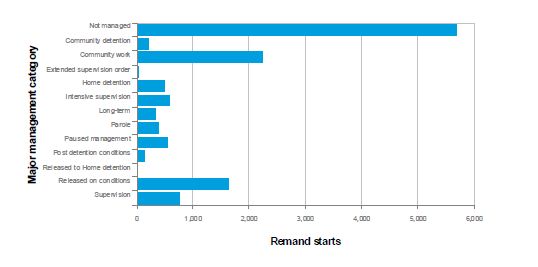
For more details see: Data Spreadsheet, Major management category - 12 Data definitions and groupings
The figure above shows the management category immediately prior to starting a remand episode. A large percentage of prisoners (44%) were not being managed by the Department immediately prior to being placed in remand.
6.12 Remand episode ends — following management category in 2010/11
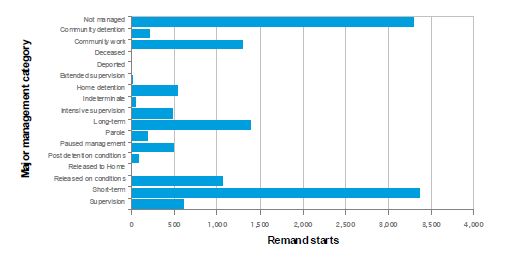
For more details see: Data Spreadsheet, Major management category - 12 Data definitions and groupings
Thirty-seven percent of all remand episodes were followed by episodes of prison sentences. Additionally, but not shown here, approximately 1000 remand episodes in the year were terminated with a prison sentence, but no actual prison-sentenced episode occurred as the remand time credits exceeded the imposed sentence time to be served.
A further 34 percent led either to a new community sentence, or the resumption of an existing community sentence or order.