2 Prison sentenced snapshots
2.1 Overview
This section is based on counts of the number of offenders with a "prison sentenced" status at given snapshot dates. The term "prison sentenced" used here differs slightly from the concept of prison muster used in other reports since it is based on Court and New Zealand Parole Board directives rather than muster counts. For more detail on this see section 11, Data source and enrichment methodology.
The earlier part of this section provides trend information based on a series of monthly snapshot dates, the later part of the section provides more detail for the single snapshot date of 30 June 2009.
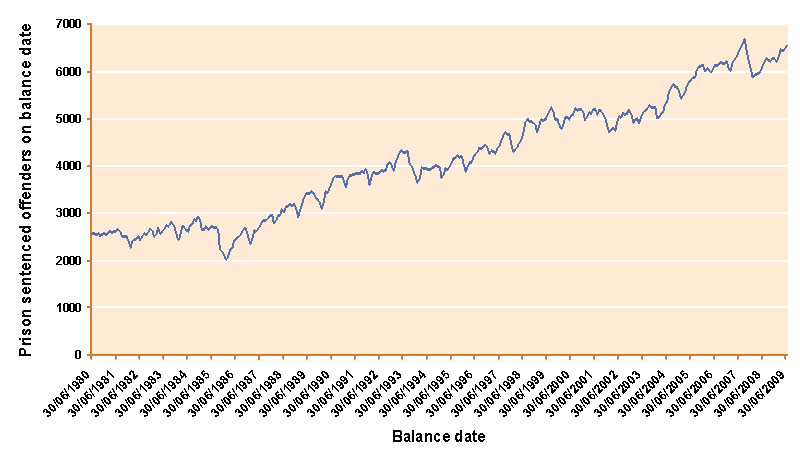
2.2 Prison sentenced snapshot trend since 1980
For more details see: data source and enrichment methodology; data spreadsheet.
The prison sentenced population demonstrates continuous and steady growth since 1986. The seasonal pattern of reduced numbers toward the end of each year is well established. It reflects the influence of the prisoner Christmas release policy[2] as well as cycles of activity involving Police and the Courts. Notable is the drop in numbers that commenced in October 2007. This is associated in part with an unusually high seasonal peak in the year prior, and also with the introduction of new community sentences that placed emphasis on keeping non-violent offenders out of jail. These new sentences were defined in the Criminal Justice Reform Bill 2007, and were incorporated as amendments to the Sentencing Act 2002 and the Parole Act 2002.
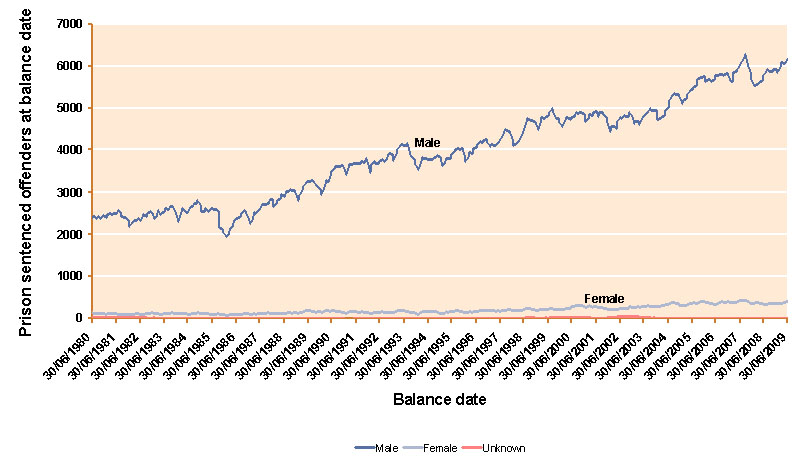
2.3 Prison sentenced snapshot trend by gender
For more details see: data source and enrichment methodology; data spreadsheet.
The proportion of prison sentenced offenders who were female increased from 4% of all prisoners in June 1986, to 5.9% of all prisoners in June 2009. Over this time period male prison-sentenced offender counts increased by 161% from 2359 to 6157 and female prison-sentenced offender counts increased by 297% from 98 to 389.
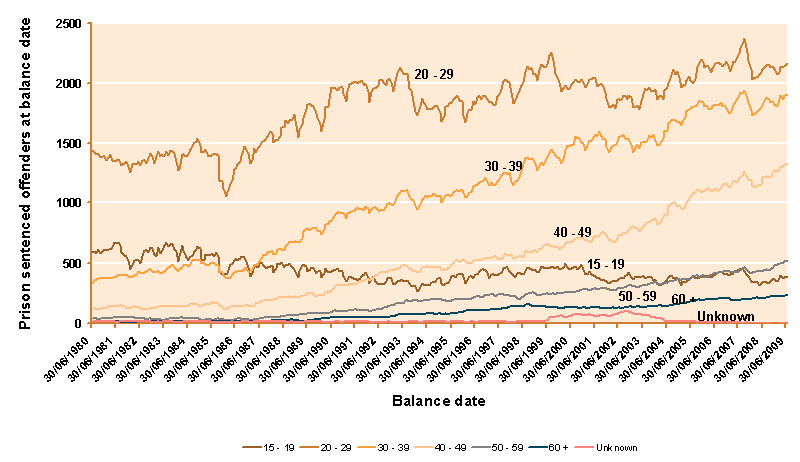
2.4 Prison sentenced snapshot trend by age
For more details see: data source and enrichment methodology; data spreadsheet.
This graph indicates a very significant change in the composition of the prisoner population over recent decades. Over almost 30 years, the number of prisoners in the 20-29 years age group has grown slowly, while the number of prisoners in the 15-19 years age group has actually declined. Growth in overall numbers has almost entirely been amongst older offenders. In 1980, prisoners aged 30 years and over made up 20% of the sentenced population; they now comprise over 60% of the total. The increase in the average age of prisoners is partly due to the longer times being served in prison but it is also a result of the changing mix of offences. Recidivist offenders also appear to be continuing to re-circulate in the system for longer.
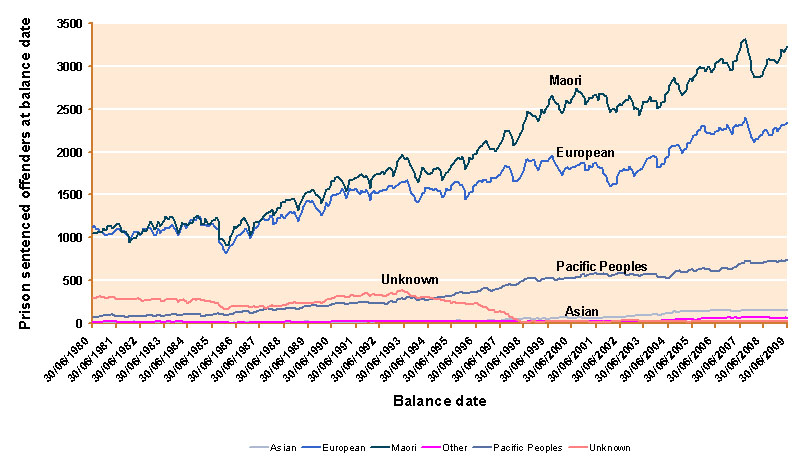
2.5 Prison sentenced snapshot trend by preferred ethnicity
For more details see: data source and enrichment methodology; data spreadsheet; preferred ethnicity.
Interestingly, the drop in prison sentenced offender counts after the introduction of the new community sentences in October 2007 appears to have applied to Mâori and European offenders but not to any marked extent to Pacific Peoples or Asians.
2.6 Prison sentenced snapshot trend by offence category
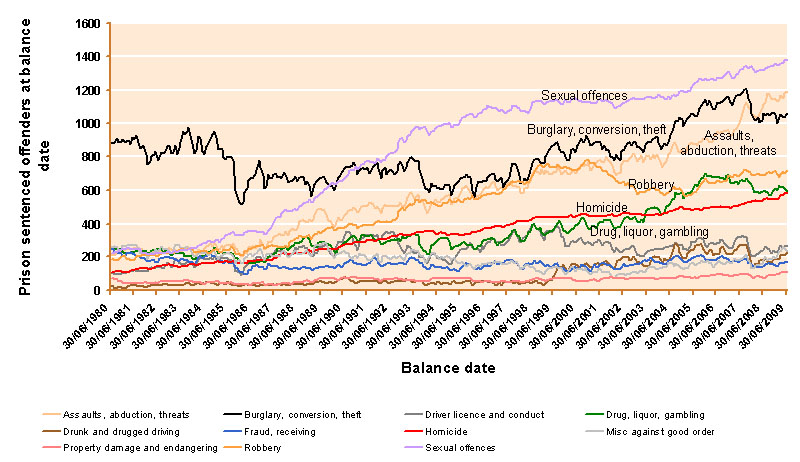
For more details see: data source and enrichment methodology; data spreadsheet; offence category.
The graph above indicates that, thirty years ago, dishonesty offenders predominated in the prison population. However, over the intervening period, much of the growth has been driven by an accumulation of those sentenced for violent and sexual offending, with drug offender counts also rising sharply in recent years.
The relative proportions in each offence category (as indicated above) is partly a reflection of the process whereby more serious offences result in longer sentences, which lead to higher rates of accumulation in the prison system. A high count of prisoners on a particular balance date could have resulted from either a high inflow of the prisoner category (burglary for example) or from high rates of accumulation of the prisoner category due to long sentences (homicide for example).
2.7 Prison sentenced snapshot trend by management category
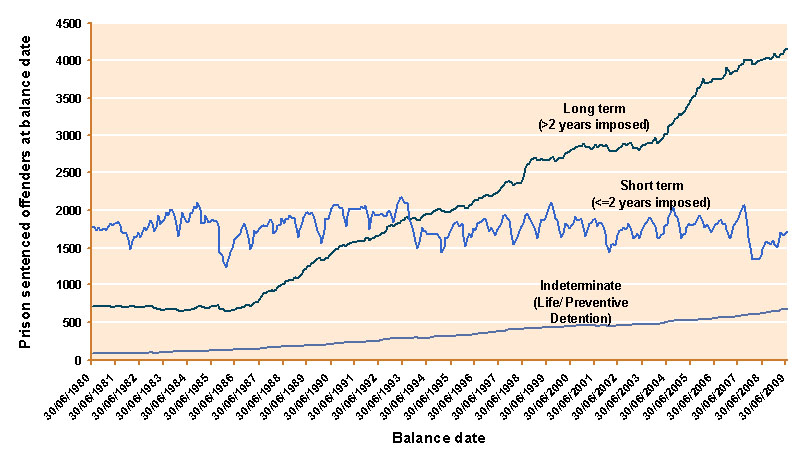
For more details see: data source and enrichment methodology; data spreadsheet; major management category.
"Short term" sentenced offender numbers (those with less than or equal to two years imposed) have been relatively stable since 1980, with the majority of the growth in sentenced prisoner numbers relating to the longer sentences imposed. In contrast (see 3.2 Prison sentenced period starts per year trend by management group) the majority of prison sentence new starts relate to the short term sentences.
The trend lines above hide considerable complexity. Since 1980, the rules around the proportion of sentence served and the timing of release have changed, as has the typical proportion of a sentence that is served as remand. The seasonal cycle discussed above, is also revealed to be a phenomenon restricted to the shorter-term prisoners.
The introduction of new community sentences in October 2007 can be seen above to have had a major impact (as intended) on short term prisoner counts with little or no impact obvious on long term and indeterminate sentenced prisoner counts.
< recent in occurring off levelling some with group this observed be can growth sustained and Significant years. 2 than greater of sentences determinate serving those are offenders sentenced prison term">
Life and Preventive Detention ("indeterminate term") offenders are slowly but steadily growing. Though numbers of new starts on indeterminate sentences are low (typically less than 50 per year), they remain in prison for long periods of time, and therefore are accumulating to become a significant sub-set of the prisoner population.
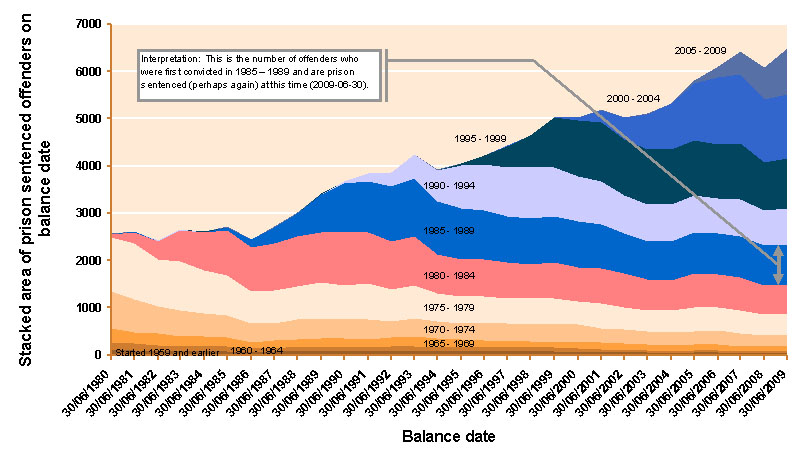
2.8 Prison sentenced snapshot trend by initial year convicted
For more details see: data source and enrichment methodology; data spreadsheet.
The graph above is produced from a series of 30th June prisoner snapshots. It provides a breakdown of the sentenced prisoner population at each snapshot by the five year band during which prisoners recorded their first conviction (includes convictions resulting in fines, discharges or disqualifications). The colour differentiated strata from left to right should not be interpreted as meaning that the same offenders were in prison continuously. Each band signifies the number of beds occupied by offenders in a cohort, which will be made up of a changing and re-circulating set of offenders.
Consistent with the age trends discussed in section 2.4, the graph above confirms the changing composition of the prisoner population, with a declining proportion of the population made up of those with only recent offending careers. For example, on 30-June-1980 almost 75% of the prisoner population had recorded their first conviction within the ten years prior to that date. By 30-June-2009, less than 38% of the prisoner population had recorded their first conviction within the previous ten years.
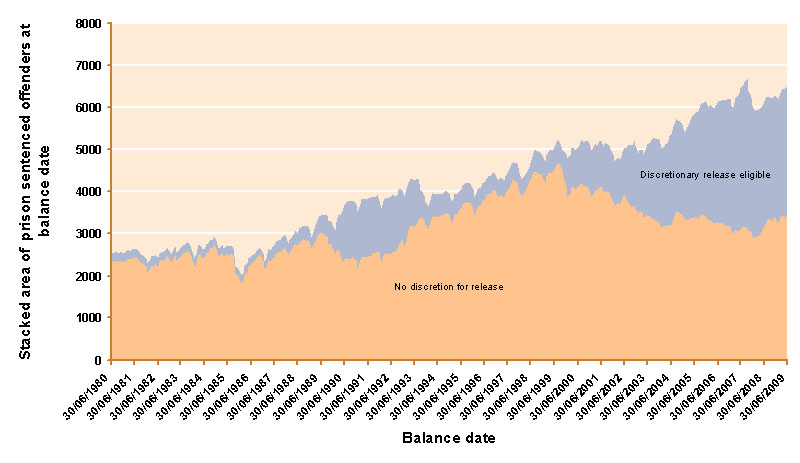
2.9 Prison sentenced snapshot trend by discretionary release eligibility
For more details see: data source and enrichment methodology; data spreadsheet; major management category.
The graph above groups the sentenced prisoner population according to current eligibility for discretionary release. Prisoners in the category "no discretion for release" include those whose sentence does not allow early release on parole or home detention, as well as those who will become eligible but have yet to pass their parole eligibility date. "Discretionary release eligible" refers to those who may be released at the discretion of the New Zealand Parole Board (or the former District Prison Boards and the National Parole Board). In 2006 this meant those who had passed their parole eligibility date or home detention eligibility date but had yet to be released or had been granted leave to apply for front end home detention but had yet to be released. With the law changes introduced in October 2007, the granting of home detention eligibility to those newly sentenced to short term prison sentences stopped. In addition, the granting of back end home detention to those with long term (>2 years imposed) changed and is now treated as a parole release with "full residential conditions" and cannot happen three months earlier than parole eligibility as previously possible.
The "discretionary release eligible" area on the graph above indicates that at 30/06/2009 some 3110 (47%) sentenced prisoners could have been released immediately if the parole board could have been convinced that they posed no risk to the community.
The growth in prisoners who are eligible for discretionary release since 2002 reflects the influence of parole laws introduced in that year, which meant that parole eligibility occurred earlier in the sentences of longer-term prisoners. However, this has not meant that prisoners have been released earlier, merely that the possibility of more adaptive justice has existed.
2.10 Prison sentenced snapshot at 30/06/2009 by gender-ethnicity-age
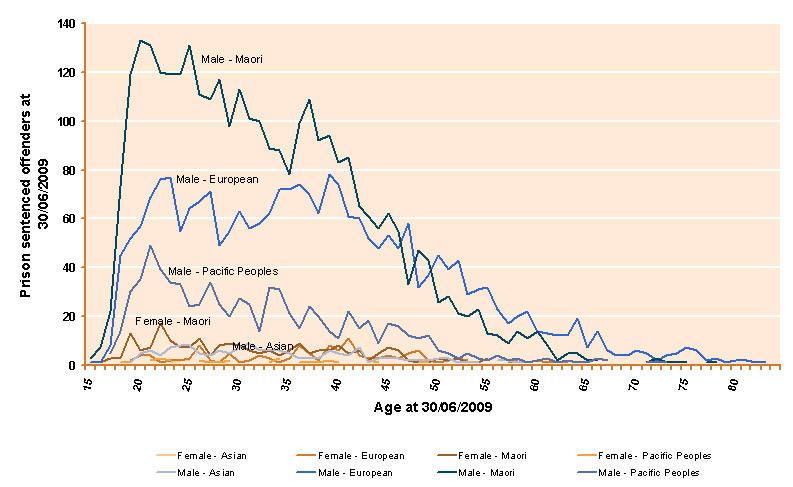
For more details see: data source and enrichment methodology; data spreadsheet; multiple ethnicity.
The graph above provides a breakdown of prison sentenced offenders by age and ethnicity, as at 30 June 2009. This indicates the preponderance of Mâori males in this population, especially in the younger age groups. For example, there were approximately twice as many Mâori 25 year old males in prison than there were NZ European males of the same age. Amongst those over 40 years of age, NZ European males become more numerous. These figures contrast sharply with the statistics for the general population given in the following graph.
2.11 New Zealand population at 30/06/2009 by gender-ethnicity-age
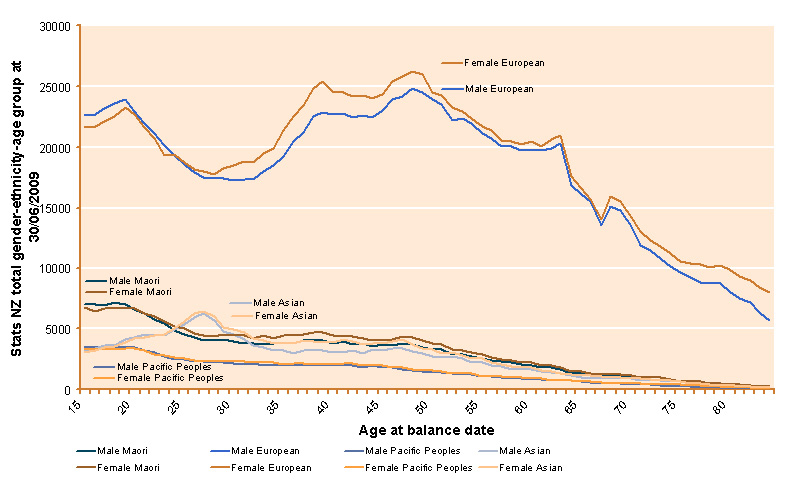
For more details see: data source and enrichment methodology; data spreadsheet; multiple ethnicity.
The source of data for the above graph was the Statistics New Zealand Table Builder website, from which the "Projected Ethnic Population of New Zealand, by Age and Sex, 2006 (base)" for 2009 using series 6 projection was extracted[3].
2.12 Imprisonment rates at 30/06/2009 by gender-ethnicity-age
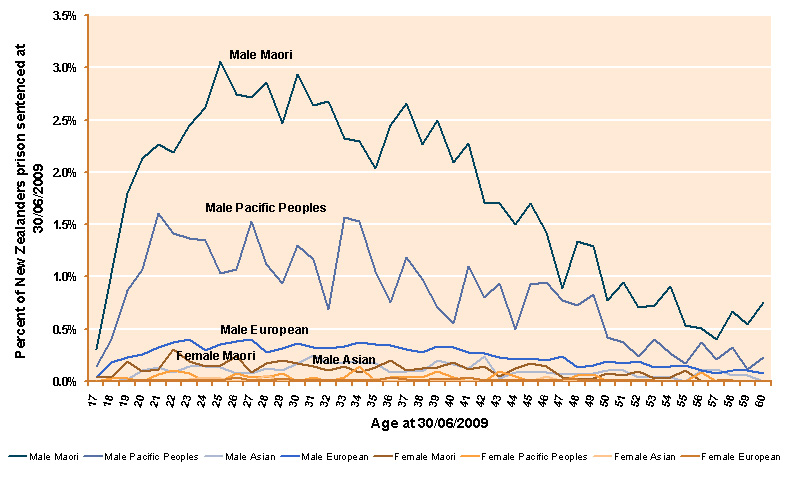
For more details see: data source and enrichment methodology; data spreadsheet; multiple ethnicity.
The graph above gives the proportion of people in prison on a sentence on 30 June 2009 for each gender-age-ethnicity sub-group in the national population. Most notably, this reveals that over 3.0% of all Mâori 25 year old males were in prison on 30 June 2009, while the proportion of NZ European 25 year old males in prison was under 0.5%. .
2.13 Prison sentenced snapshot at 30/06/2009 by imposed term and age
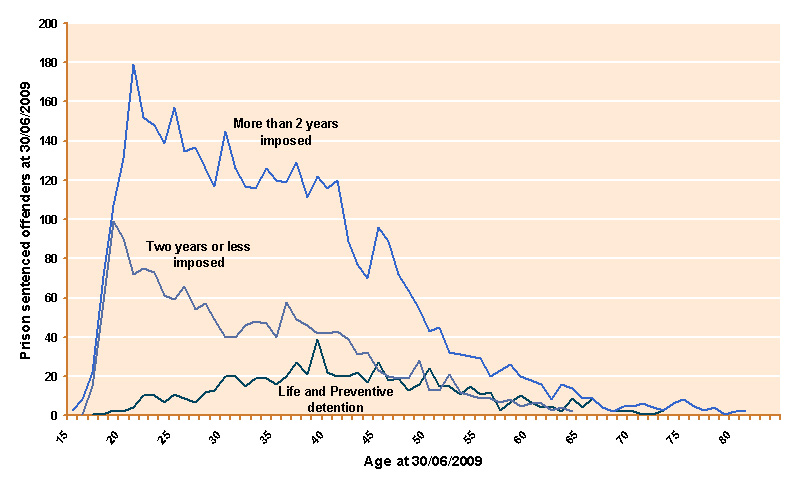
For more details see: data source and enrichment methodology; data spreadsheet; major management category.
Life and Preventive detention prisoners at any one time have a higher average age than the shorter term prisoners and generally there are less of them in any age group. The graph above indicates that at 30 June 2009 the number of Life and Preventive detention prisoners over the age of 50 exceeds the number of prisoners over the age of 50 serving short terms (<= 2 years imposed).
2.14 Prison sentenced snapshot at 30/06/2009 by offence category and age
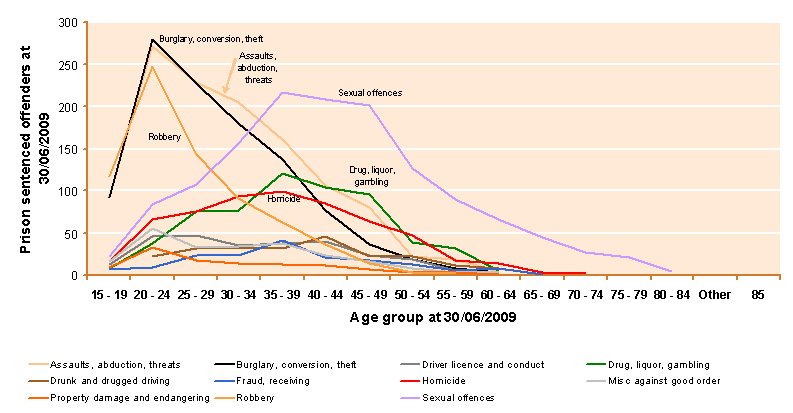
For more details see: data source and enrichment methodology; data spreadsheet; offence categories.
Footnotes
[2] Prisoners whose release date falls between mid-December and early January the following year are eligible to be released early in December; this policy aims to promote reintegration by ensuring that prisoners are able to access relevant social services and supports that might otherwise be closed during the Christmas - New Year period.
[3] These population estimates make use of the multi-ethnicity concept such that individuals are counted in all ethnic groups they identify with. One consequence of this is that the total of "Ethnic Populations" does not equal the total population of the country. Similarly, the imprisonment rates for each group shown are based on the ratio of prison sentenced offenders at 30/06/2009 relative to the total population as at 30/06/2009 (as estimated by Statistics New Zealand). This method is imperfect due to differences in circumstances of how, when and where the ethnicity question was asked (in prison vs. in the National census). However, the numbers still provide a useful comparison tool.