Prison Performance Table methodology
Custodial Performance Table
Custodial Performance consists of two elements, the core security gateway and the internal procedures score. There are four grades of performance and prisons are ranked based on the internal procedures score within each grade.
1.1 Core security gateway
The core security gateway is a test for certain incidents that are considered unacceptable.
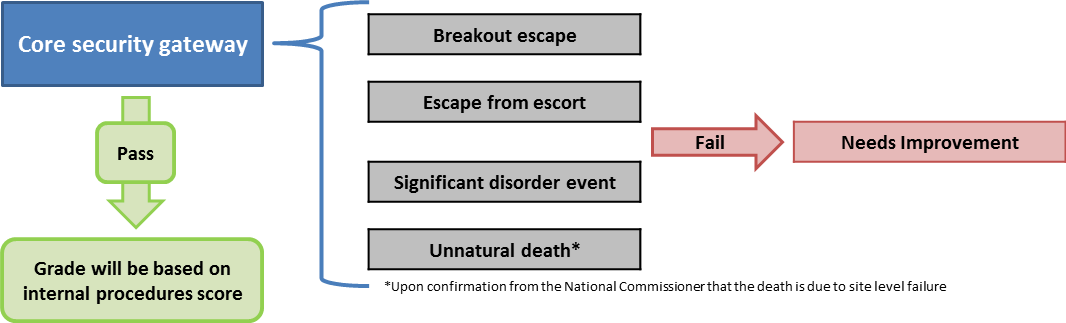
If a prison records a core security incident in a quarter, the prison will achieve a grade of Needs Improvement regardless of the internal procedures score. If a prison records no core security incidents in a quarter, the prison proceeds through the gateway to be graded based on the internal procedures score.
1.2 Internal procedures score
The internal procedures score is a measure of the safety and security of each facility. There are two components of the internal procedures score:
- Baseline score – reflects the unique characteristics of the average daily population of each prison including size, security classification, sentence group and population turnover
- Negative events score – undesirable incidents that occur are assigned a weighting to reflect the severity of the incident type
Both the baseline score and negative events score are calculated every quarter for every prison. The internal procedures score incorporates the phased results for the latest four quarters to drive continual performance.
1.2.1 Baseline score
A baseline score for each prison is calculated based on the security classification and sentence status of the average daily population. Each security classification and sentence status group is given a weighting based on the likelihood of negative KPI events occurring within that group in recognition of the difficulties faced by each prison. The baseline score is comprised of three components:
- Population score
- New receptions factor
- Minimum baseline
Population score
The population score recognises that the likelihood of negative events occurring depends on the security classification and sentence group of the prison population. Each security classification and sentence group is given a weighting based on the likelihood of negative KPI events occurring, this weighting is then applied to the average daily population.
Example:
Security class / sentence group | Weighting | Avg daily population | Population score |
Minimum | 0.10 | 114 | 11.40 |
Low | 0.20 | 176 | 35.20 |
Low medium | 0.25 | 190 | 47.50 |
High | 0.30 | 231 | 69.30 |
Maximum | 0.40 | 1 | 0.40 |
Unclassified | 0.35 | 18 | 6.30 |
Remand – accused | 0.35 | 129 | 45.15 |
Remand – convicted | 0.35 | 35 | 12.25 |
Total |
| 894 | 227.50 |
New receptions factor
The new receptions factor recognises the effect a throughput of new prisoners has on operating conditions. The baseline score is increased depending on the number of new receptions in each prison.
Example:
Step 1 – Calculate the rate of new receptions per prisoner for each prison
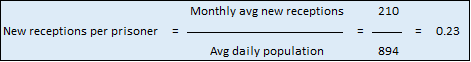
Step 2 – Calculate the new prisoner factor

Step 3 – Calculate the baseline score for the current quarter by increasing the population score by the new prisoner factor
![]()
Minimum baseline score
Prisons with small populations attract low baseline scores. Very low baseline scores result in a prisons being unable to sustain any significant negative event without dropping to the Needs Improvement grade. It can be difficult for a prison with a small population to improve in the following quarter due to the phased weighting of negative events.
A minimum baseline of 50 is applied to minimise the volatility for smaller prisons due to negative events.
1.2.2 Negative events score
The negative events score is determined by prison performance across a set of negative events. Each negative event is assigned a score.
Example:
Negative event | Weighting | Volume | Negative score |
| |||
Core security events | |||
Breakout escape | 140 | ||
Escape – from escort | 140 | ||
Significant disorder event | 140 | ||
Unnatural death | 140 | ||
| |||
Other internal procedures measures | |||
Serious assault – prisoner / staff | 110 | ||
Escape – abscond | 70 | ||
Escape – breach temporary release | 70 | ||
Serious assault – prisoner / prisoner | 50 | 1 | 50 |
Disorder event | 35 | 1 | 35 |
Wrongful detention | 30 | 1 | 30 |
Wrongful release | 30 | ||
Number of justified complaints | 6 | 1 | 6 |
Non-serious assault – prisoner / staff | 3 | 1 | 3 |
Non-serious assault – prisoner / prisoner | 1.5 | 4 | 6 |
% of positive random general drug test results >5% | 25%* | 15% | 61 |
* % of baseline score | |||
| |||
Total negative events score |
|
| 191 |
1.2.3 Weighted average internal procedures score
The internal procedures score represents the difference between the baseline score and the negative events score. The internal procedures score is a weighted average score across four quarters to reduce the effect of isolated incidents in any individual quarter and drive consistent performance. The current month result has the greatest emphasis, with the earlier quarters having diminishing influence.
Example:
| Internal procedures score | Baseline score | Negative events | |||
| Period | Phasing | Quarterly | Phasing | Quarterly | Phasing |
Current quarter | 60% | 245.31 | 147.19 | 191.33 | 114.80 |
Previous quarter | 25% | 250.10 | 62.53 | 310.00 | 77.50 |
Two quarters back | 10% | 260.70 | 26.07 | 150.00 | 15.00 |
Three quarters back | 5% | 255.20 | 12.76 | 221.00 | 11.05 |
| Total | 100% | 248.54 | 218.35 | ||
The difference between the weighted average baseline and the weighted average negative events score is expressed as a percentage of the baseline. This percentage is the internal procedures score and determines which grade is applied to each prison for the quarter.
Example:
| Internal procedures | ||
Weighted average baseline score | 248.54 | |
Weighted average negative events score | 218.35 | |
Variance between weighted average baseline and negative events score | 30.20 | |
Internal procedures score | 12.1% | |
Internal procedures grade | >=0% and <50% | Effective |

Industry, Treatment and Learning Performance Table
Industry, Treatment and Learning performance is measured against a set of KPIs. Each KPI has specified minimum and maximum levels of performance. If prison performance is below this level there will be no rehabilitation score for that KPI.
If the prison performs between the minimum and maximum levels, a pro-rata calculation is applied. For example, if a prison has a minimum level of 75% and a maximum level of 95% for a KPI and they scored 80%, they have achieved 84% of the maximum level. The prison will receive 84% of the max score for the KPI.
Industry, Treatment and Learning KPI | Minimum | Target | Max score |
% of prisoners completing programme | 75% | 100% | 18 |
Prisoner starts against plan | 0% | 100% | 18 |
% of initial offender plans on time | 85% | 100% | 18 |
Hours spent in structured activity per prisoner | 0% | 100% | 3 |
% of prisoners entitled to offender plan that received one | 95% | 100% | 15 |
25% of prisoners engaged in employment | 0% | 100% | 12 |
Total industry, treatment and learning points awarded are expressed as a percentage of the total available industry, treatment and learning points. Results for the latest four quarters are averaged and this percentage then determines the industry, treatment and learning grade.
