Appropriation - Prison-based Custodial Services
This appropriation is limited to the provision of custodial services for offenders required by law to be detained in custody. This includes remand prisoners (people awaiting trial and offenders convicted but not yet sentenced), those offenders sentenced to imprisonment, and any other offender legally required to be detained in custody.
What we do
This appropriation encompasses two outputs, the management of custodial services and health.
Management of custodial services ensures prisoners complete the correct imposed sentence or order, comply with the specific restrictions and requirements of their sentence or order, are not harmed, are treated fairly, and that their legitimate needs are met. Safe and secure management of custodial facilities maintains public safety; prisoners are safely and securely contained, an appropriate setting for provision of rehabilitative interventions is provided and offenders are held to account.
Corrections Health Services is a primary healthcare provider for the prison population and provides a service equivalent to that of General Practitioners in the community. Corrections Health Services has a central role in the prevention, detection, and management of health conditions among the prison population and in providing ongoing care for prisoners who require it. Our provision of healthcare to prisoners is a key enabler of their engagement in rehabilitation activity. When an offender’s physical and mental health needs are met they are better able to focus on rehabilitation and preparing for release.
Operating Context
Custodial Services
Previous Years | Current Year | Next Year | |||||
Activity Information | 2011/12 Actual volume | 2012/13 Actual volume | 2013/14 Actual volume | 2014/15 Actual volume | 2014/15 Budget volume | 2014/15 Variance | 2015/16 Budget volume |
Number of Offenders | |||||||
The average prison population | 8,587 | 8,614 | 8,460 | 8,732 | 8,246 | 486 | 8,500 – 8,750 |
The maximum number of prisoners held | 8,738 | 8,743 | 8,640 | 8,906 | 8,393 | 513 | N/A* |
* This measure has been excluded from the 2015/16 budget and will not be reported in 2015/16.
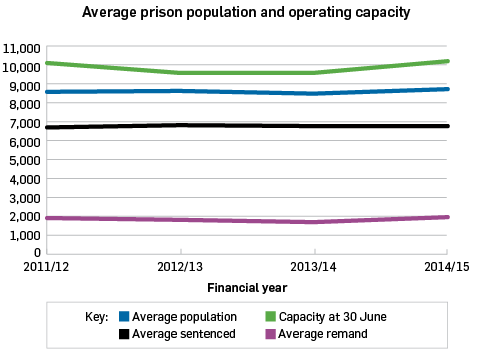
The average prison population in 2014/15 was 272 prisoners (3%) higher than in 2013/14, and was 486 prisoners (6%) above the Ministry of Justice forecast for this year. This is equivalent to the capacity of a medium sized prison such as that located at Whanganui Prison.
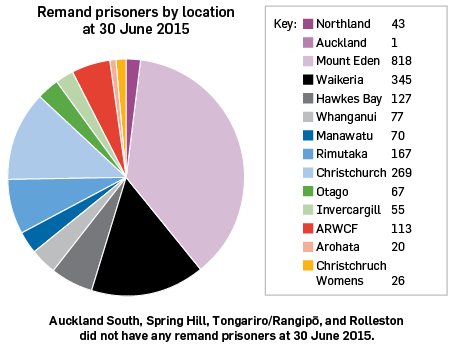
A major component of the above forecast prison population for this year has been the number of prisoners held while on remand. The following graphs show the trend of the prison population for 2014/15 in reference to the operating capacity ceiling, and the breakdown of remand prisoners by location.


The average remandee population has risen by 283 prisoners in 2014/15 compared to 2013/14. On average, remand prisoners represent 23% of the total prison population for 2014/15 compared with 20% for 2013/14. The higher number of prisoners presents challenges for staff and for the provision of suitable accommodation, as prisoner placements, interactions, and transportations all become more frequent and complex in line with the increase.
Looking ahead
Corrections has undertaken a significant review of our performance management framework; new measures that are better operational assessments of performance have been developed, which focus on areas not currently measured.
The new activity information to be measured for 2015/16 is outlined below;
Activity Information | 2015/16 Budget volume |
Number of Offenders | |
The number of prisoners received into custody1 | 19,000 – 20,000 |
The number of prisoners released from custody2 | 8,300 – 8,800 |
1. This measures includes all prisoners.
2. The releases measures includes only sentenced and not remand prisoners.
Health
Previous Years | Current Year | Next Year | |||||
Activity Information | 2011/12 Actual volume | 2012/13 Actual volume | 2013/14 Actual volume | 2014/15 Actual volume | 2014/15 Budget volume | 2014/15 Variance | 2015/16 Budget volume |
Number of Offenders | |||||||
The number of prisoners who require a health screening upon reception | 29,295 | 30,253 | 29,751 | 31,840 | 30,500 | 1,340 | N/A* |
The total number of health consultations with healthcare staff | 234,421 | 264,422 | 178,8593 | 129,714 | 124,300 | 5,414 | N/A* |
* This measure has been excluded from the 2015/16 budget and will not be reported in 2015/16.
3. Reporting of the volume of health consultations undertaken was refined in late 2013 and appropriate staff training was carried out so that this measure distinguishes consultations regarding health issues from routine interactions with prisoners such as dispensing medication. The decrease in volumes for this measure in 2013/14 is because of this redefinition coming into effect in the later part of the 2013/14 financial year.
Health triage assessments take place upon the reception of offenders into prison, and are the first opportunity for Health Services staff to identify issues that will require further or ongoing treatment, as well as those that will impact on a prisoner’s ability to engage in rehabilitative activity. The assessments ensure that prisoners’ health needs are addressed in a clinical and timely manner.
In line with the higher prison population, Corrections delivered a higher number of consultations than expected during 2014/15.
How we performed
Custodial Services
Corrections makes use of a number of measures to monitor our performance in the delivery of custodial services, including: the prison environment, the security of our facilities, and our effectiveness in preventing the introduction of contraband to prisons.
Previous Years | Current Year | Next Year | |||||
Performance Measures | 2011/12 Actual standard | 2012/13 Actual standard | 2013/14 Actual standard | 2014/15 Actual standard | 2014/15 Budget standard | 2014/15 Variance | 2015/16 Budget standard |
A Safe Corrections System | |||||||
Quality | |||||||
The number of non-serious/no injury prisoner on prisoner assaults | 812 | 720 | 750 | 837 | ≤750 | (87) | N/A* |
The number of non-serious/no injury prisoner on staff assaults | 338 | 337 | 314 | 397 | ≤300 | (97) | N/A* |
The percentage of initial offender plans completed within required timeframes | – | – | New for 2014/15 | 77% | ≥85% | (8%) | ≥85% |
Quantity | |||||||
The number of general random drug tests sampled | 4,140 | 4,191 | 4,295 | 4,454 | ≥4,200 | 254 | N/A* |
* This measure has been excluded from the 2015/16 budget and will not be reported in 2015/16.
A safe corrections system
Corrections’ three year Staff Safety Plan began in July 2013 and introduced a comprehensive campaign to make every instance of violence unacceptable as well as encouraging improved reporting of all incidents. Although the number of non-serious and no injury assaults on staff increased from 314 to 397 between 2013/14 and 2014/15, and on prisoners from 750 to 837, the total number of serious assaults has decreased since 2013/14.
The percentage of initial offender plans completed within required timeframes was previously an internal measure. This was changed to become the new performance measure and the number of eligible offenders was expanded, which meant that pre-existing achievements were reduced as a percentage. This has meant that the annual goal for 2014/15 was not achieved, although the target of 85% was met in the last quarter of the financial year. It is anticipated that the annual goal will be achieved in 2015/16.
During the 2014/15 financial year 4,454 drugs tests were carried out in prisons under the general random drug testing regime, which is ahead of expectations and last year’s results. The increase from last year is in line with the overall increase in the prison population. For a second consecutive year the percentage of general random drug tests that returned positive results was 4%, outperforming our target of 6% or less.
Looking ahead
The new performance targets for 2015/16 are outlined below;
Performance Measures | 2015/16 Budget standard |
The Integrity of Sentences and Orders | |
QUALITY | |
The number of escapes (including absconds, breakouts, etc.) | 5 (Lower than average across the past 5 years) |
A Safe Corrections System | |
QUALITY | |
The number of prisoner on prisoner assaults that are serious | 46 (Lower than average across the past 5 years) |
The number of prisoner on staff assaults that are serious | 11 (Lower than average across the past 5 years) |
The number of justified complaints by prisoners to the Corrections Inspectorate | 41 (Lower than average across the past 5 years) |
The proportion of justified complaints upheld for not meeting process requirements) | Benchmark set at end of 2015/16+ |
+ As this measure has not been previously monitored, baseline information is required to be collected in order to set an appropriate target.
Integrity of sentences and orders
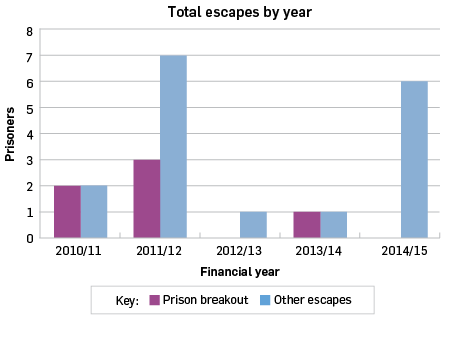
Our ongoing investment in prison security at prisons Corrections manages has seen a sustained reduction in prison breakout escapes, with only one occurrence in the last three years and none during 2014/15.
During 2014/15 there were six reported other escapes which are classified as either prisoners absconding or breaching temporary release. All of these occurred when the prisoners were already outside of prison. Two of these occurred during escorts to hospital, two during escorts to court, one from a prisoner work party outside prison, and one during an overnight temporary release. A review of every escape is undertaken and where possible steps are taken to minimise the occurrence of these events in the future.
One significant example of the improvements Corrections is making to reduce the risk of prisoners escaping when outside prison is the increased use of Audio-Visual Link (AVL) connections. AVL allows prisoners to attend remand hearings via a video link rather than appearing in person. This results in fewer transportations, which is one of the most common situations in which prisoners may find opportunities to abscond from custody.

How we performed
Health
| Previous Years | Current Year | Next Year | ||||
Performance Measures | 2011/12 Actual standard | 2012/13 Actual standard | 2013/14 Actual standard | 2014/15 Actual standard | 2014/15 Budget standard | 2014/15 Variance | 2015/16 Budget standard |
A Safe Corrections System | |||||||
Quality | |||||||
The percentage of newly received prisoners who have a health triage assessment on the day of reception | 98% | 99% | 98% | 99% | ≥95% | 4% | N/A* |
The percentage of new receptions who have been assessed as requiring a cardio-vascular risk assessment (CVRA), and receive a CVRA within eight weeks of identification | New for 2012/13 | 83% | 94% | 97% | ≥90% | 7% | N/A* |
The number of identified Health Centres achieving Cornerstone® Accreditation | New for 2012/13 | 6 | 5 | – | 1 | (1) | N/A* |
The number of Health Centres that retained their Cornerstone® Accreditation status following completion of an annual review | – | – | New for 2014/15 | 16 | 15 | 1 | New for 2015/16 100% accreditation |
* This measure has been excluded from the 2015/16 budget and will not be reported in 2015/16.
Corrections met all of the performance measures related to health in this financial year, including all Health Centres retaining Cornerstone® Accreditation. This means all prison Health Centres have demonstrated they continue to meet the standards set by the NZ College of General Practitioners for primary healthcare and the staff meet the professional standards of an Accredited Health Centre. This is a significant achievement considering the challenges of our working environment and given that only 80% of GP clinics in the community are Cornerstone® Accredited.
How much did it cost?
2013/14 | 2014/15 | 2015/16 | |||
Actual $000 | Actual $000 | Budget (unaudited) $000 | Supplementary estimates (unaudited) $000 | Forecast* (unaudited) $000 | |
Revenue | |||||
Crown | 752,900 | 788,167 | 725,445 | 788,167 | 811,289 |
Departmental | 232 | 140 | – | 196 | – |
Other | 3,566 | 7,935 | 2,191 | 8,380 | 2,486 |
Total revenue | 756,698 | 796,242 | 727,636 | 796,743 | 813,775 |
Total expenses | 759,218 | 789,299 | 727,636 | 791,243 | 813,775 |
Net surplus/(deficit) | (2,520) | 6,943 | – | 5,500 | – |
* Forecast financial statements have been prepared using Budget Economic Fiscal Update (BEFU) 2015
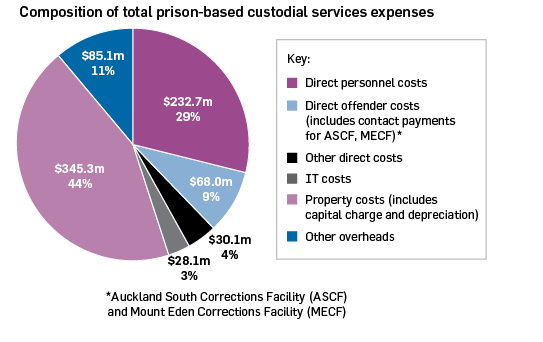
The total expense for this appropriation was $789.3 million. Corrections has 18 prison sites across the country, a significant amount of the expenditure therefore relates to costs associated with ownership, management and operation of these assets; such as depreciation, maintenance and capital charge. Expenditure includes costs associated with the operation of Auckland South Corrections Facility (ASCF) from May 2015.
Personnel costs is another significant cost associated with this appropriation as prison staff account for the majority of Corrections overall staffing levels.
Refer to the chart below for the composition of total expenditure by major category.

Expenditure was $30.1 million higher than for the equivalent 2013/14 financial year mainly due to:
- an increase in capital charge of $17.5 million arising from the asset revaluation of land and buildings as at 30 June 2014
- contract expenses of $12.9 million relating to operations at ASCF which commenced in May 2015.
Other revenue mainly comprises insurance proceeds for claims in relation to the Christchurch earthquake and the Spring Hill Corrections Facility riot costs which were incurred in previous years and board charged to prisoners on Release to Work.

