Appropriation - Rehabilitation and Reintegration
This appropriation is limited to the provision of case management and interventions designed to address the underlying causes of criminal re-offending.
What we do
Corrections reduces re-offending by providing offenders with opportunities for rehabilitation and reintegration through five outputs: case management, rehabilitation, training and education, offender employment and reintegration. Providing these opportunities allows offenders to have the skills and support to lead law-abiding lives after the end of their sentence or order.
Case management focuses on planning and managing a prisoner’s rehabilitation and reintegration needs which are reflected in a high quality offender plans for each individual.
Rehabilitation challenges behaviours that lead to offending. When appropriate programmes and pathways are made available and offenders are motivated to take part in them, there is a better chance that they will successfully reintegrate into the community at the end of their sentence or order.
Corrections provides training and education that supports offenders to address lifelong learning barriers and gain recognised qualifications and employment experiences.
Offender employment opportunities provided by Corrections look to develop work habits, experience, training and skills, increasing offenders’ chances for post-release employment.
Reintegration services managed by Corrections focus on creating pathways for people integrating back into the community, by assisting them to address employment, accommodation, living skills, health/wellbeing, community links and other reintegration needs.
Operating context
The prisoner journey as it relates to rehabilitation and reintegration:
Corrections has developed targeted strategies to reduce re-offending through six areas of focus:
- tackling alcohol and drug abuse
- more rehabilitation that works
- interventions delivered by probation staff
- education, job skills and working prisons
- real jobs on release and
- partnering with iwi and community groups.
Case management
The process of case management encompasses the planning and management of a prisoner’s rehabilitation and reintegration needs. This involves assessing rehabilitation requirements such as alcohol and drug programmes, planning literacy and numeracy education for those who require it, along with other training and education opportunities. This provides prisoners with the ability to go on to higher levels of education and acquire the skills to move into employment post-release.
Rehabilitation
Drug and alcohol abuse is a major driver of crime in New Zealand. Approximately two-thirds of New Zealand prisoners have substance abuse problems, and it is estimated that over 50% of crime is committed by people under the influence of drugs or alcohol. Corrections targets alcohol and drug rehabilitation to ensure progress is being made toward reducing re-offending.
Training and education
More than 60% of prisoners lack basic skills in literacy and numeracy. Without basic English literacy and numeracy skills, offenders are limited in their ability to gain qualifications and secure employment. Not having these skills will impact on all aspects of offenders’ lives, making it more difficult to gain employment and increasing the risk of re-offending. Corrections has an opportunity to support offenders to lift their skill levels and improve their chances of gaining employment on release.
Offender employment
Recent data has shown that up to 60% of offenders in prison were unemployed prior to imprisonment. We know that people who find stable employment on leaving prison are significantly less likely to commit crime in the 12 months following their release. Support in finding stable employment is therefore a central part of Corrections’ efforts to help offenders build positive lifestyles.
Working prisons are a key part of reducing re-offending and are places of industry, treatment, learning and constructive activities. Corrections began piloting the working prison framework in 2012. Since then seven prisons have become fully functional working prisons and we are committed to making every publicly managed prison a working prison by 2017. Working prisons engage eligible prisoners in a regular 40 hour week to prepare them for release and reintegration. The 40 hours are made up of rehabilitation and reintegration, education and training, employment and other constructive activity.
Reintegration
Corrections can help to make an ongoing differences in the lives of offenders, turning their release from prison from a time of vulnerability to one of renewed, positive involvement in their communities. Through the use of external providers, community groups and iwi, Corrections supports offenders to find stable accommodation and employment, set up bank accounts and other reintegrative needs.
How we performed
Case management
Previous Years | Current Year | Next Year | |||||
Performance Measures | 2011/12 Actual standard | 2012/13 Actual standard | 2013/14 Actual standard | 2014/15 Actual standard | 2014/15 Budget standard | 2014/15 Variance | 2015/16 Budget standard |
Quality and Timeliness | |||||||
The percentage of prisoners entitled to receive an offender plan that received one | 96% | 98% | 99.5% | 98% | ≥95% | 3% | ≥95% |
Case management performance is measured by undertaking a monthly check of the prison population to ensure that all offenders entitled to a plan have one. The annual result against this measure for 2014/15 was 98%.
Corrections introduced a new scheduling process in this financial year, which is underpinned by effective assessment of needs and case management. The intent is to significantly increase the number of programmes and interventions we deliver to prisoners. The new scheduling process:
- provides consistent scheduling approaches across the prisons. This helps schedulers to save an average of 4.3 minutes per wait-listed prisoner, allowing a reinvestment of time to incorporate additional scheduling functions
- is expected to increase the completion rate in rehabilitation programmes over the time.
Rehabilitation
Previous Years | Current Year | Next Year | |||||
Performance Measures | 2011/12 Actual standard | 2012/13 Actual standard | 2013/14 Actual standard | 2014/15 Actual standard | 2014/15 Budget standard | 2014/15 Variance | 2015/16 Budget standard |
Quantity | |||||||
The number of offenders who start a rehabilitation programme: | New for 2012/13 | 11,279 | 14,035 | 13,217 | 13,247 | (30) | N/A* |
| New for 2012/13 | 4,950 | 7,439 | 7,950 | 7,911 | 39 | N/A* |
| New for 2012/13 | 6,329 | 6,596 | 5,267 | 5,336 | (69) | N/A* |
Quality | |||||||
The percentage of offenders who start and complete a rehabilitation programme: | |||||||
| New for 2012/13 | 86% | 85% | 86% | ≥75% | 11% | ≥85% |
| New for 2012/13 | 63% | 63% | 59% | ≥65% | (6%) | ≥65% |
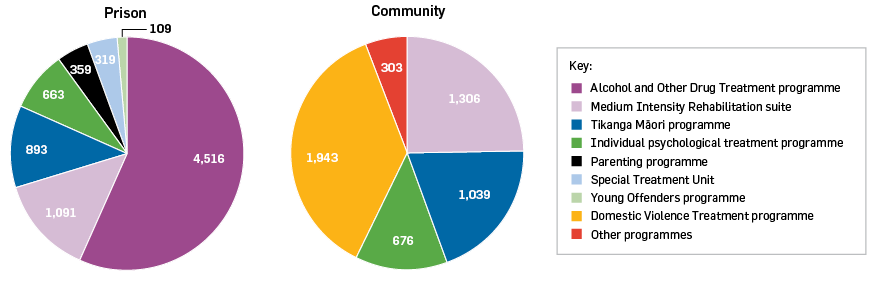
In the financial year 2014/15, 7,950 prisoners started a prison-based rehabilitation programme, and 5,267 started a community-based rehabilitation programme. These results are broadly in line with performance expectations. To address the issue of alcohol and drug dependencies over 50% of prison programmes target prisoners’ alcohol and drug needs. In the community, over a third of programmes target reducing domestic violence.
The percentage of community-based offenders who start and complete a rehabilitation programme has reduced to 59% this year (2013/14: 63%). To an extent this reduction reflects the difficulties that Corrections faces with community-based offenders attending rehabilitation programmes; all programmes experience a natural attrition rate as maintaining the motivation and participation of offenders outside the custodial environment is a challenge, and not all community sentences compel offenders to take part in rehabilitation activities.
Training and education
Previous Years | Current Year | Next Year | |||||
Performance Measures | 2011/12 Actual standard | 2012/13 Actual standard | 2013/14 Actual standard | 2014/15 Actual standard | 2014/15 Budget standard | 2014/15 Variance | 2015/16 Budget standard |
Quality | |||||||
The percentage of prisoners who demonstrate measurable gains with literacy and numeracy5 | 89% | 82% | 71% | 75% | ≥75% | – | N/A* |
Quantity | |||||||
The number of prisoners who receive literacy and numeracy programmes in prison | New for 2012/13 | 2,981 | 3,801 | 3,240 | 2,969 | 271 | N/A* |
The total number of qualifications achieved by prisoners while in prison6 | 3,145 | 3,160 | 3,858 | 3,698 | 3,505 | 193 | 4,240 |
5. This performance measure assesses the percentage of prisoners participating in the adult literacy and numeracy classes (Pathways Education) that demonstrate improvement as measured by the providers’ use of the Tertiary Education Commission Literacy and Numeracy for Adults Assessment Tool (the ‘TEC tool’).
6. This performance measure includes New Zealand Qualifications Framework (NZQF) National Certificates and other NZQF certificates levels 2, 3 or above as a completed qualification, Limited Credit Programmes and Modularised Training Programmes, Trade Tickets (industry specific license to practice eg welding), Vocational driver’s licenses, Health and Safety qualification accredited by Industry Training Organizations (ITOs), eg First Aid, Grow Safe and Site Safe and NCEA qualifications completed while in prison. It excludes the literacy and numeracy programmes currently done in prison (both by OE embedded within other qualifications and through the Foundation Skills programmes) as they support offenders to undertake more complex training and education, rather than providing a qualification and NCEA qualifications which prisoners were awarded before entering the prison system.
* This measure has been excluded from the 2015/16 budget and will not be reported in 2015/16.
To address prisoners lack of basic skills in literacy and numeracy Corrections has recently introduced a new approach to intensive literacy and numeracy that will provide greater support to those prisoners with the highest need, so that they have a better chance of achieving qualifications.
This has seen the percentage of prisoners who demonstrate measurable gains in literacy and numeracy increasing from the previous year and being in line with expectation.
The following table shows the number of qualifications achieved by prisoners was ahead of expectation and that there was a significant increase in level 3 qualifications gained from the previous year as offenders become eligible to achieve higher qualifications.
Level | Type | 2013/14 Actual | 2014/15 Actual | Change % |
Less than Level One | LCP7 / MTP8 | 4 | 92 | |
Trade Ticket | 16 | 24 | ||
Driver Licence | 17 | – | ||
Other | – | 5 | ||
Qualifications achieved | 37 | 121 | 227% | |
Level One | LCP / MTP | 106 | 73 | |
National Certificate | 119 | 159 | ||
Qualifications achieved | 225 | 232 | 3% | |
Level Two | LCP / MTP | 1,482 | 1,112 | |
National Certificate | 1,165 | 869 | ||
Trade Ticket | 59 | 29 | ||
Health and Safety | 363 | 453 | ||
Driver Licence | 261 | 229 | ||
Qualifications achieved | 3,330 | 2,692 | (19%) | |
Level Three | LCP / MTP | 82 | 478 | |
National Certificate | 115 | 167 | ||
Trade Ticket | 13 | – | ||
Health and Safety | 46 | – | ||
Qualifications achieved | 256 | 645 | 151% | |
Level Four | National Certificate | 10 | 8 | |
Qualifications achieved | 10 | 8 | (20%) | |
Total | 3,858 | 3,698 | ||
7. Limited Credit Programme (LCP)
8. Modularised Training Programme (MTP)
Offender employment
Support in finding stable employment is a central part of Corrections’ efforts to help offenders build positive lifestyles. Recent data has shown that people who find stable employment on leaving prison are significantly less likely to commit crime in the 12 months following their release.
The following outcomes make up Corrections’ framework for offender employment:
- forming a pathway to stable, real jobs on release
- representing the most cost effective way for offenders to gain experience and skills
- avoiding unacceptable levels of risk.
Due to their criminal histories and often limited education, many prisoners experience difficulty in finding jobs upon release. By partnering with employers and industry we have worked to help more prisoners find employment. Real Jobs on Release is designed to help offenders find suitable employment, either following the end of their sentence or during its final stages. Support includes training calibrated to the needs of the labour market, and assistance in building routine and a sense of purpose into offenders’ daily lives.
Previous Years | Current Year | Next Year | |||||
Performance Measures | 2011/12 Actual standard | 2012/13 Actual standard | 2013/14 Actual standard | 2014/15 Actual standard | 2014/15 Budget standard | 2014/15 Variance | 2015/16 Budget standard |
Quantity | |||||||
The number of prisoners who have engaged in employment activities | New for 2012/13 | 10,085 | 9,777 | 10,620 | 11,460 | (840) | N/A* |
* This measure has been excluded from the 2015/16 budget and will not be reported in 2015/16.
The number of prisoners engaged in employment activities was under the performance standard but 9% (843) higher than 2013/14.
Working prisons remains a focus for Corrections and has continued to expand with seven prisons now operating as working prisons. Working prisons engage eligible prisoners in a regular 40 hour working week.
While working prisons increased employment activities from last year, this increase was partially offset during the year as Corrections reassessed the security classification of prisoners in activities that took them outside of the secure prison environment – for example some horticultural and forestry activities. This reduction was a result of a high profile breach of temporary release which lead to Corrections reviewing prisoners eligible to work outside the prison environment. This impacted Corrections’ ability to meet the expected target.
Looking ahead
The new performance targets for 2015/16 are outlined below;
2015/16 Budget standard | |
QUALITY | |
The average number of hours engaged in industry and learning activities per prisoner | Benchmark set at end of 2015/16+ |
+As this measure has not been previously monitored, baseline information is required to be collected in order to set an appropriate target.
Reintegration
Reintegration is the process of successfully transitioning offenders back into the wider community from custody with constructive attitudes and behaviours.
Previous Years | Current Year | Next Year | |||||
Performance Measures | 2011/12 Actual standard | 2012/13 Actual standard | 2013/14 Actual standard | 2014/15 Actual standard | 2014/15 Budget standard | 2014/15 Variance | 2015/16 Budget standard |
Quality | |||||||
The number of offenders referred by case managers through to Out of Gate providers | - | New for 2013/14 | 1,685 | 2,862 | 2,615 | 247 | N/A+ |
+ This measure has been excluded from the 2015/16 budget and will not be reported in 2015/16.
Out of Gate (OOG) is a navigation-style service to support the reintegration of offenders sentenced to two years imprisonment or less, or those in custody on remand. These offenders are known to face a range of difficulties on release, including getting access to help they need before or as soon as they leave prison.
The OOG service, now in its second year, has had 4,547 referrals since commencing. The number of referrals to OOG in the year to June 2015 was 2,862 against the target of 2,615. This has enabled Corrections to achieve the 21 month target of 4,300 set when the service began in October 2013.
Results of OOG have seen 67% of prisoners who complete their programme and received the service remain out of prison for six months and 53% for 12 months.
Looking ahead
The new performance target for 2015/16 is outlined below;
Performance Measures | 2015/16 Budget standard |
Quality | |
The number of prisoners who start reintegration services | 4,300 |
How much did it cost?
2013/14 | 2014/15 | 2015/16 | |||
Actual $000 | Actual $000 | Budget (unaudited) $000 | Supplementary estimates (unaudited) $000 | Forecast* (unaudited) $000 | |
Revenue | |||||
| 141,967 | 134,770 | 149,048 | 134,770 | 162,649 |
| 72 | 40 | – | 56 | – |
| 37,943 | 39,204 | 29,694 | 34,768 | 29,694 |
Total revenue | 179,982 | 174,014 | 178,742 | 169,594 | 192,343 |
Total expenses | 161,937 | 169,122 | 178,742 | 169,594 | 192,343 |
Net surplus/(deficit) | 18,045 | 4,892 | – | – | – |
* Forecast financial statements have been prepared using Budget Economic Fiscal Update (BEFU) 2015
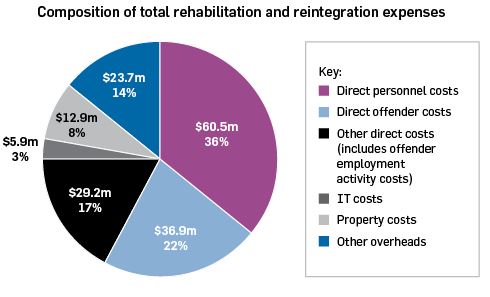
The total expense for this appropriation was $169.1 million. Direct expenses accounted for 75% of total expenses in 2014/15, which included approximately $69 million on the provision of intervention programmes and case management, $40 million on offender employment activities and $18 million on psychological services.
Refer to the chart below for the composition of total expenditure by major category.
Actual expenditure was $7.2 million more than 2013/14 actuals mainly due to:
- an increase of $2.3 million attributable to a full year of Out of Gate
- an increase in logging volumes which resulted in additional costs of $1.2 million (offset by increased sales)
- an increase of $0.9 million on reducing re-offending programmes
- $1.3 million livestock cost of sale as a result of de-stocking in preparation for the sale of the Tongariro/Rangipo land.
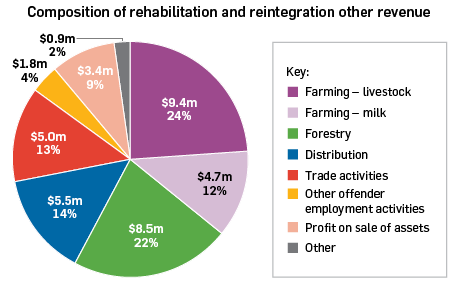
Other revenue mainly comprises sale of goods relating to offender employment activities, over half of which relates to farming and forestry.
Refer to the chart below for the composition of other revenue.