Performance on the Physical Readiness Assessment
Author: Dr Alan Walmsley, Physical Readiness Assessment Moderator, Department of Corrections
Author biography:
Alan has worked in sport and exercise for more than 40 years, having held positions at the University of Otago, Massey University, and the University of Manchester. He is a life member and former Deputy Chair of Sport and Exercise Science New Zealand and a former council member of the International Society of Biomechanics. Alan has developed occupational fitness assessments for Fire and Emergency New Zealand, and joined Corrections in March 2013 to design and develop the Physical Readiness Assessment (PRA). Following the national roll-out of the PRA in April 2017, Alan took up the role of Moderator to monitor PRA delivery and performance standards.
Introduction
Tests of physical fitness for duty are common in correctional jurisdictions throughout the world because they assure employers and staff members that they able to keep themselves and their colleagues safe in physically demanding situations. For example, several Australian state jurisdictions have fitness tests for both recruits and serving officers, as do both the English and Scottish Prison services.
Fitness tests generally fall into two types: tests of general fitness using established elements that might be performed in a commercial gym, and occupationally related tests that use simulations of tasks actually carried out by corrections personnel. Of the international fitness tests investigated prior to development of the Physical Readiness Assessment (PRA), two stand out as being very similar to the final form of the PRA because they are substantially simulations of frontline duty:
- Correctional Officer Physical Aptitude Test (COPAT) used by Alberta Correctional Services
- Fitness Test for Ontario Correctional Officer Applicants (FITCO) used by Ontario Correctional Services.
The design and development process used for the PRA was based on that used by Jamnik et al (2010) to develop FITCO.
Structure of the PRA
The PRA is designed to provide an indication of the occupational physical performance of frontline custodial staff. However, the PRA also indicates the general level of fitness of participants because performance in some elements of the PRA is dependent on aerobic and anaerobic fitness and muscular strength and endurance.
The elements of the PRA are based on the need for any assessment of occupational fitness to reflect the actual requirements of satisfactory performance in the job. Therefore, the PRA is based on a scenario that reflects a typical sequence of events in a corrections officer’s day:
“A corrections officer is walking from one unit to another to conduct a search. The search is undertaken and during the search an emergency ‘Break - Break - Break’ call is received. The corrections officer runs as quickly and safely as possible to the scene of the emergency and has to use physical force to restore order. Once order is restored, the corrections officer notices an unconscious colleague, and so removes him/her to a place of safety for others to take over care. Once the emergency is dealt with, the corrections officer walks back to the original unit”.
The PRA is composed of six elements; a 300m maximum speed walk, a simulated search, a simulated emergency response, simulated spontaneous C&R, simulated rescue, and a 300m recovery walk. The time for the walking and running sections and the total time taken are recorded and generate scores. The simulated C&R score is determined from measurement of the maximum sustained horizontal force as a percentage of body weight. The five scores generated are combined to produce the overall score, which is used to place staff in one of three performance zones; red (well below average), amber (below average) or green (average or above). This approach is a more appropriate measure of fitness to undertake the role than a simple pass/fail criterion because it places an individual in the population of corrections officers and also allows the individual to target training to specific elements that may be causing them issues.
PRA Performance Standards
Data from a sample of serving corrections officers were used to develop the scoring system shown in Table 1. Analysis of the raw data confirmed that the individual element scores and the overall score were approximately normally distributed and so a scoring system based on standard deviations was appropriate.
Table 1: The PRA scoring system based on z-scores
z-score | <= -2 | <= -1.5 | <= -1 | <= -0.5 | >-0.5 < 0.5 | >= 0.5 | >= 1.0 | >= 1.5 | >=2 |
PRA Score | 1 | 2 | 3 | 4 | 5 | 6 | 7 | 8 | 9 |
Description | WELL BELOW AVERAGE | BELOW AVERAGE | AVERAGE | ABOVE AVERAGE | WELL ABOVE AVERAGE | ||||
The overall score for the PRA is determined as follows:
- if there are no scores of 1 or 2, the overall score is the rounded average of the individual scores
- if there is one individual element score of 1 or 2, the overall score is either 2 or the rounded average of the individual scores, whichever is lower
- if there are two or more individual element scores of 1 or 2, the overall score is either 1 or the rounded average of the individual scores, whichever is lower.
For those staff members returning a result in the red zone, the Department has contracted two external providers of support programmes to assist staff to return to the green zone. The programmes are tailored to the needs and preferences of the individual client and may include supervised gym sessions, supervised pool sessions, nutritional advice, physiotherapy, or any other intervention the provider recommends. All costs are met by the Department, including the cost of an initial medical examination to rule out any clinical factors that might have impacted on PRA performance.
PRA performance data
From 1 April to 20 December 2017, 2,023 custodial staff members (1,521 men and 502 women) aged between 18 and 72 were rostered to complete the PRA. Of those rostered, 210 staff members (162 men and 48 women) chose to defer the PRA for up to 12 months. Deferment was made an option prior to the introduction of the PRA because it was felt that some staff members might need more time to prepare. Staff had been encouraged to try out the PRA on a no-consequences basis so that they had an indication of their level before undertaking the PRA. However, staff didn’t have to provide a reason for deferring, and we should not assume that those who deferred would not have performed satisfactorily. Some of those candidates who deferred have subsequently undertaken the PRA and have returned a result in the green zone.
Of those staff members attempting the PRA, 31 men and 12 women started but did not complete the PRA, which resulted in 1,770 complete results. Many of those not completing the PRA stopped because they experienced an injury or other discomfort, but it should not be assumed that they would have returned an unsatisfactory result if they had completed the PRA.
Figure 1: Distribution of scores broken down into age groups
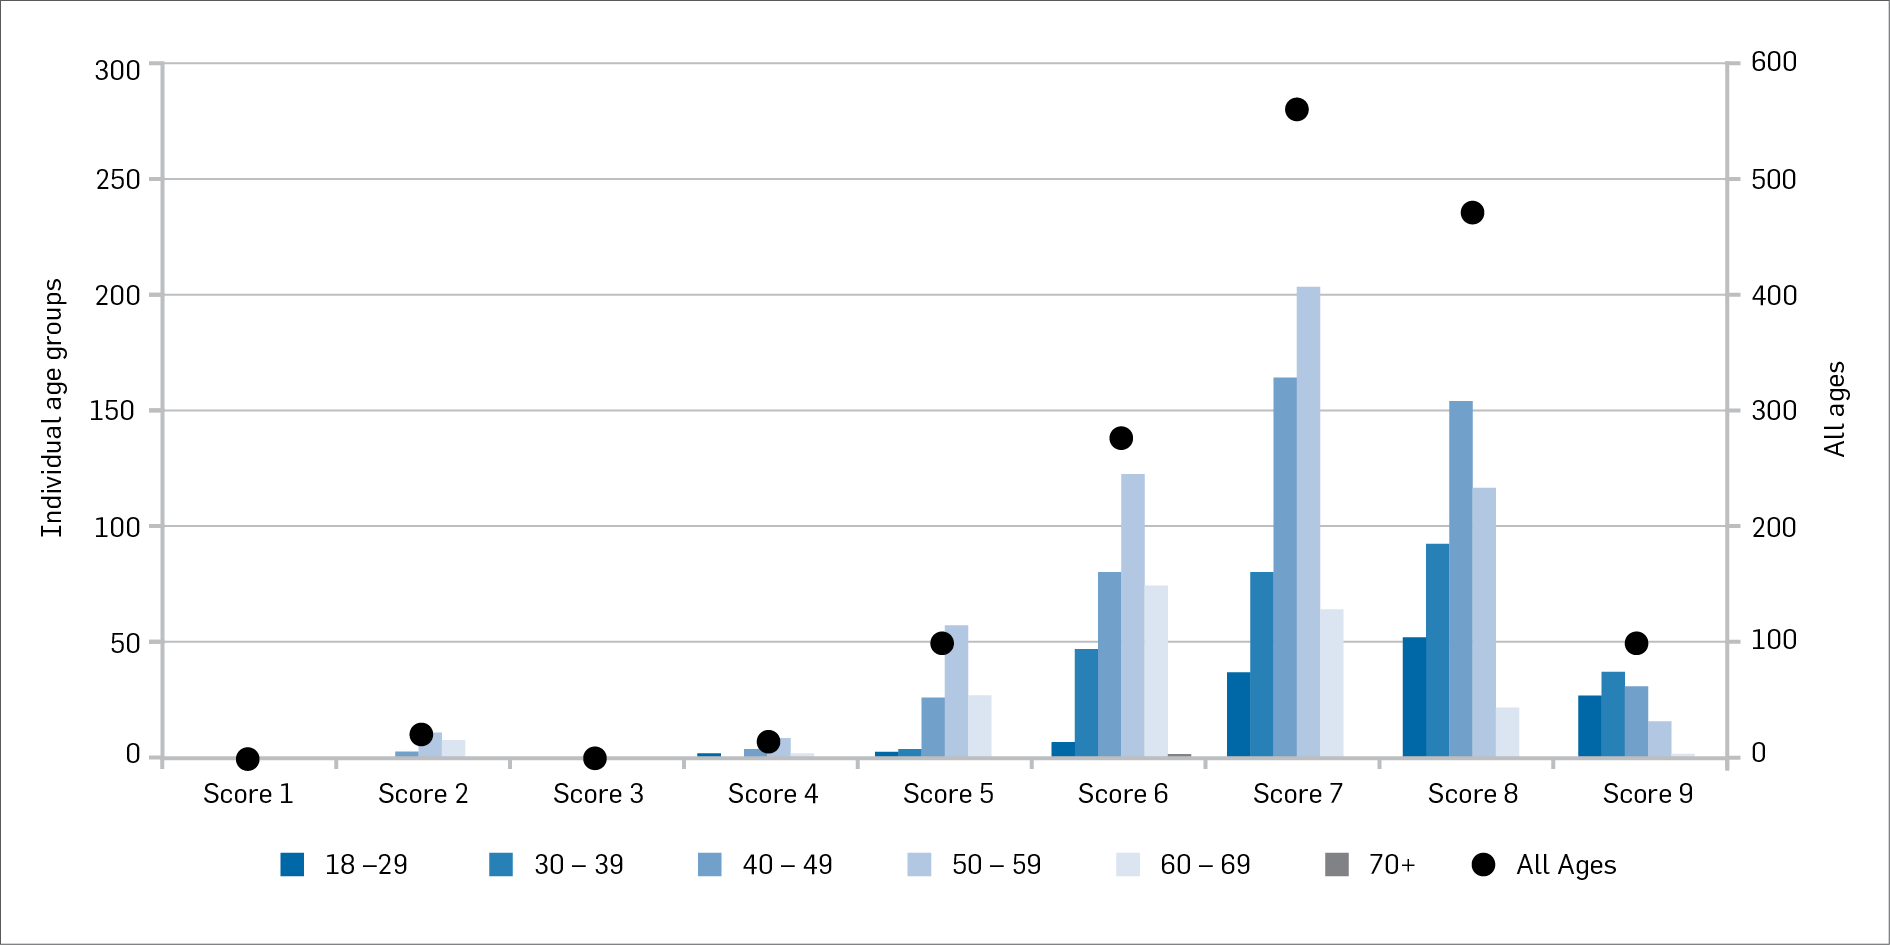
Figure 1 shows the distribution of scores for the 1,770 participants broken down into 10 year age groups. The distribution was expected to be approximately normal with a mode of five. However, the mode for all age groups taken together and the age groups less than 60 was seven, whereas for the age groups over 60 the mode was six.
Figure 2: Distribution of overall scores as percentage of sample split at age 60 compared with the expected normal distribution
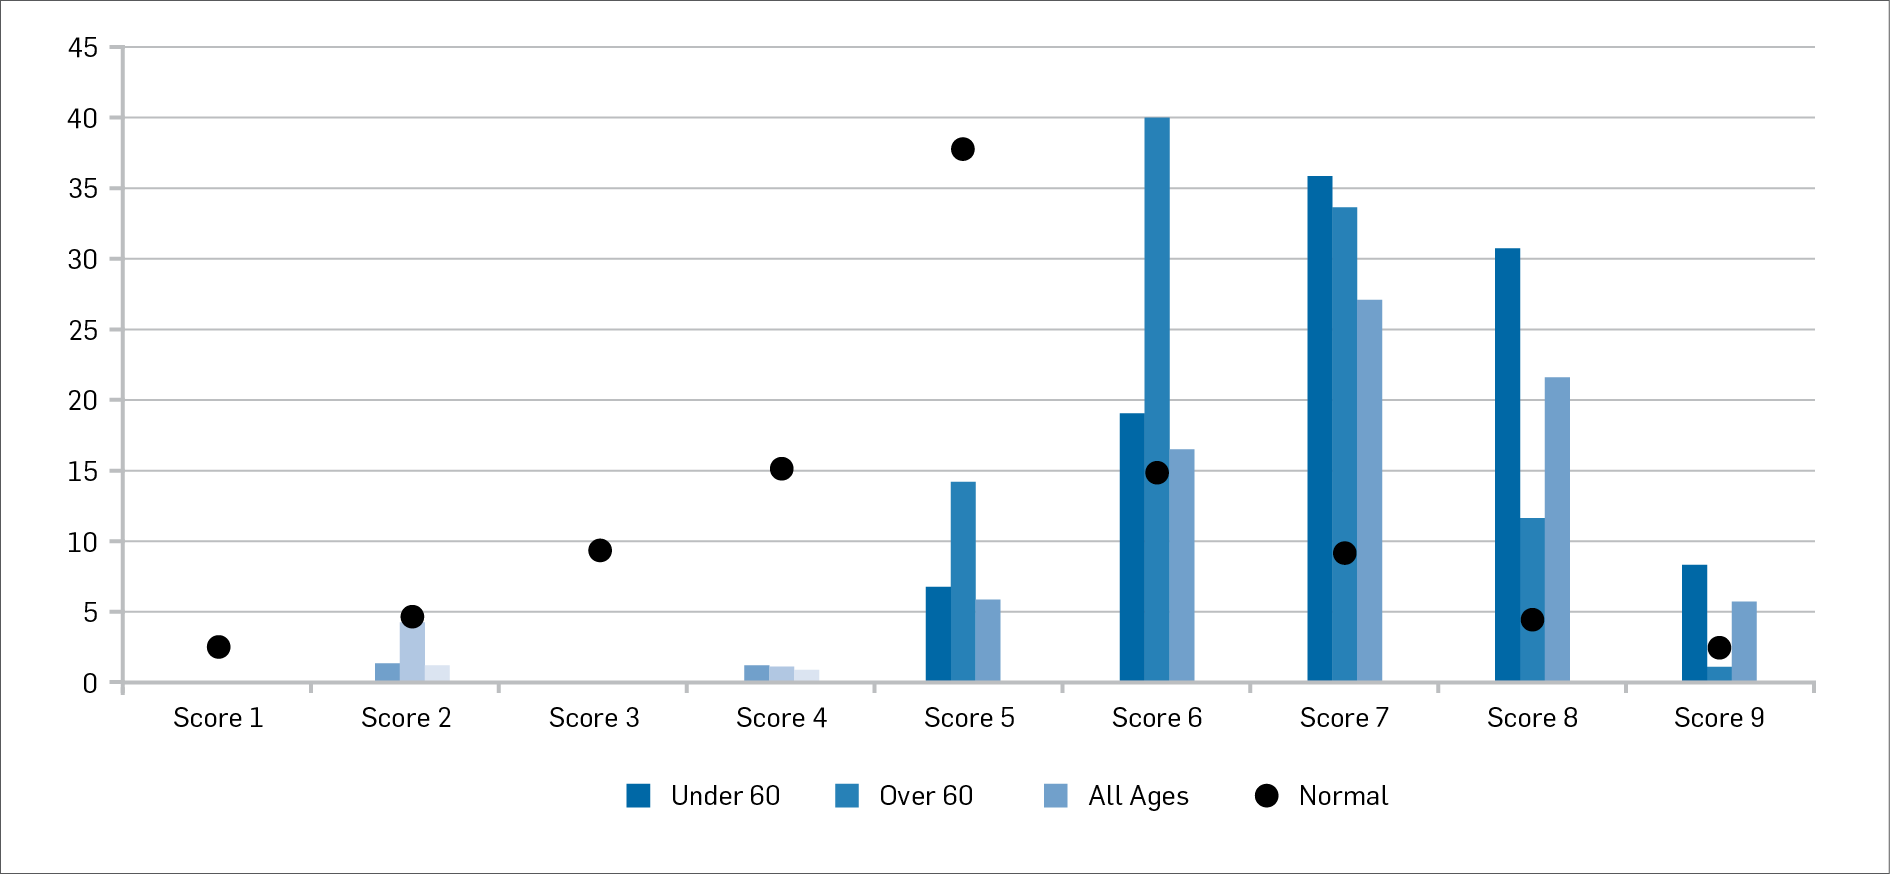
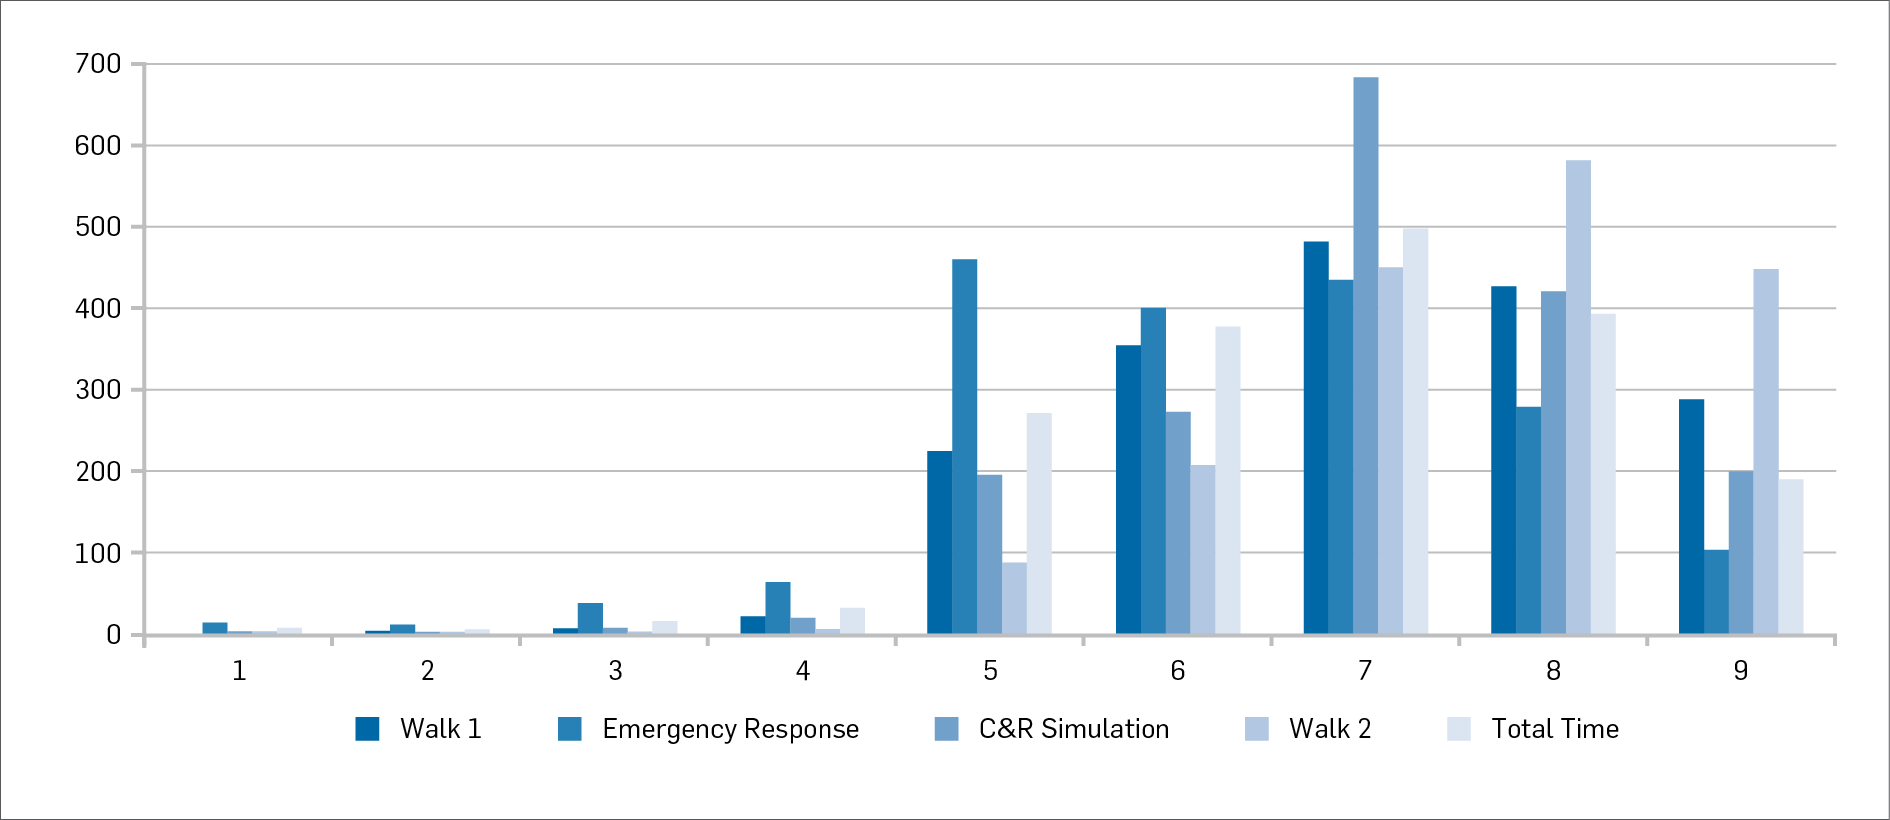
Figure 2 illustrates that the distribution of overall scores for all age groups was substantially better than the expected distribution derived from the initial study data. It appears that the actual mean of the measured data, which are used to derive the scores, is about one standard deviation better than the mean estimated from the initial study data. Figure 3 confirms that this is the case for all elements of the PRA although the Emergency Response element is rather different from the rest.
Figure 3: Count of participants in each score for each element of the PRA
Age and gender effects
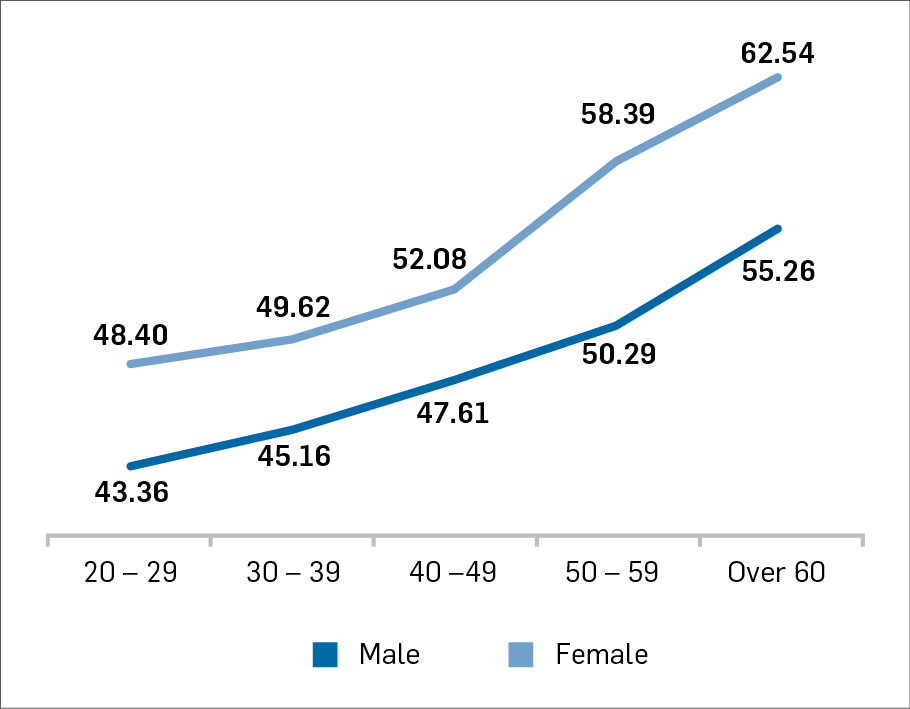
Because the PRA currently requires the same level of performance for all ages and both women and men, a two way ANOVA[1] was carried out, with age group and gender as factors. The analysis revealed significant main effects and interactions (p<.001) for the total time for the PRA, the C&R simulation result, and the emergency response time. Participants were grouped into those under 30, 30 to 39, 40 to 49, 50 to 59, and over 60. Figure 4 indicates that women were significantly slower than men (p<.001) by about 10% for the whole PRA and about 20% slower than men in the emergency response and that both genders slowed down with age.
Figure 4: Mean Total Time for the PRA and Emergency response time split by age group and gender
Similarly, Figure 5 indicates that women produced significantly lower forces (p<.001) than men by about 10% of body weight and that the difference tended to increase slightly with age.
Figure 5: C&R Simulation result as % of body weight split by age and gender.
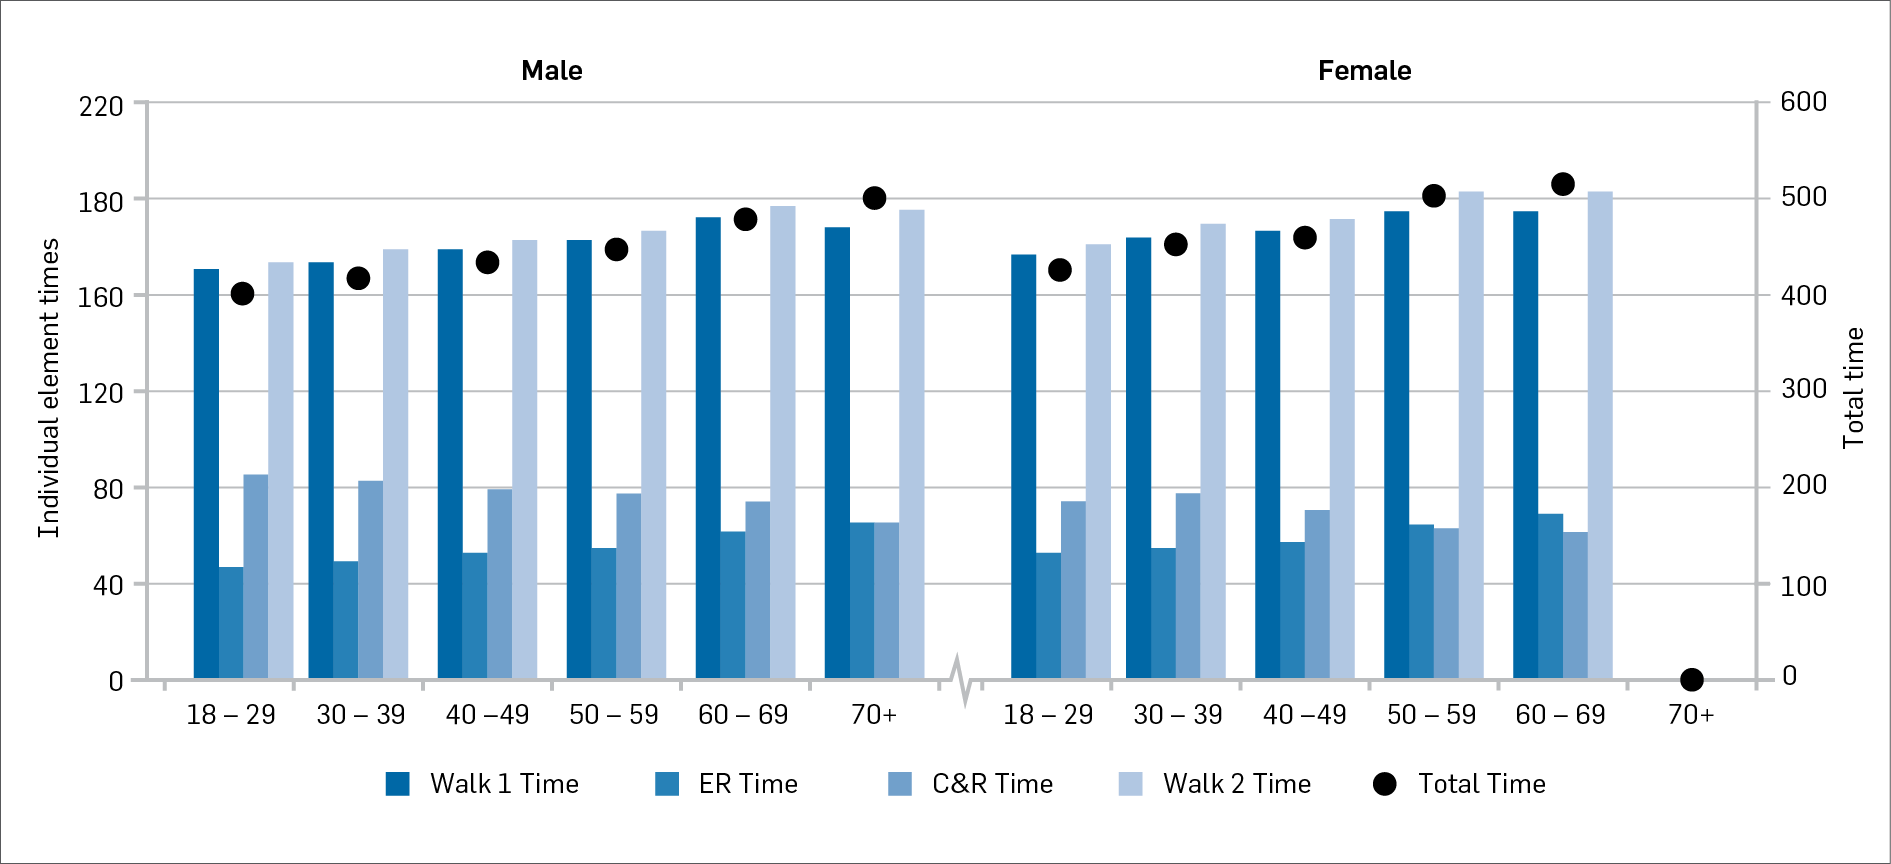
All the measured elements show a small weak association with age (R2 from 0.04 to 0.16): the mean for the timed elements increases by about 0.4s per year for individual elements and 2s per year for the total time, while the mean for the C&R Simulation element reduces by about 0.3% of body weight per year. The rate of change with age differed between men and women most notably in the Emergency Response, the C&R Simulation, and the non-timed elements (see Table 2). It appears likely that the Simulated Rescue element is the major source of the difference in the untimed elements because performance is dependent on absolute strength.
Table 2: Mean rate of change of element data with age in seconds per year for timed elements, and % body weight per year for the C&R Simulation.
| All | Male | Female |
|---|---|---|---|
Walk 1 | 0.47 | 0.47 | 0.48 |
Emergency Response | 0.33 | 0.31 | 0.42 |
C&R Simulation | -0.29 | -0.26 | -0.44 |
Walk 2 | 0.45 | 0.44 | 0.54 |
Total Time | 2.03 | 1.89 | 2.71 |
Non-timed elements | 0.79 | 0.68 | 1.27 |
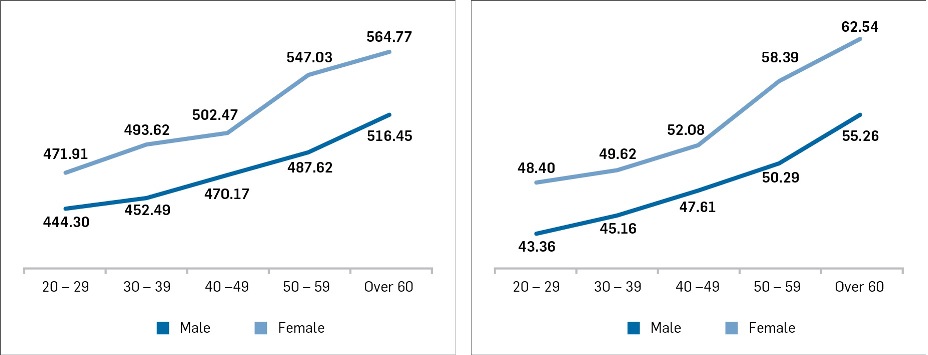
Figure 6 indicates that the rate of change of element means is reasonably consistent across age decades with small differences between men and women. In general, the rate of change is slightly greater for women than men. For example, the mean total time for the PRA increased by 18.9s/decade for men and 27.1s/decade for women, 8.2s/decade faster than men.
The small reduction in performance with increasing age is reasonably consistent across age groups. However, the rate of increase in individual elements is so small (generally less than 5s/decade in the timed elements) that introduction of age related scoring could unfairly discriminate between candidates. For example, a 59 year old taking 209s for walk 1 would score 4, whereas a 60 year old taking the same time would score 5.
Figure 6: Mean element data split by age group for male and female participants
In the timed elements, women returned a smaller spread of data than men, with a greater mean time (between 6.2s and 10.2s on individual elements and 42.7s overall) and a slightly smaller standard deviation (see Table 3). In the C&R Simulation, women, on average, produced horizontal forces 10% of body weight lower than men with a slightly smaller standard deviation (1.3% BW).
Table 3: Differences between male and female data on the timed or measured elements of the PRA.
Min | Max | Mean | Std Dev | ||
|---|---|---|---|---|---|
Walk 1 (s) | Female | 134.1 | 229.2 | 172.3 | 16.4 |
Male | 111.0 | 265.8 | 164.2 | 16.3 | |
Difference | 23.1 | -36.6 | 8.1 | 0.1 | |
Emergency Response (s) | Female | 32.8 | 90.7 | 54.6 | 10.1 |
Male | 28.7 | 111.0 | 48.4 | 8.7 | |
Difference | 4.1 | -20.3 | 6.2 | 1.4 | |
C&R Simulation (% BW) | Female | 36.5 | 143.3 | 64.5 | 13.5 |
Male | 34.9 | 125.9 | 74.5 | 14.8 | |
Difference | 1.6 | 17.5 | -10.0 | -1.3 | |
Walk 2 (s) | Female | 134.5 | 282.1 | 176.1 | 26.9 |
Male | 113.0 | 339.4 | 165.9 | 25.6 | |
Difference | 21.5 | -57.3 | 10.2 | 1.4 | |
Total Time (s) | Female | 382.2 | 826.4 | 515.8 | 82.2 |
Male | 325.6 | 855.9 | 473.1 | 72.4 | |
Difference | 56.6 | -29.5 | 42.7 | 9.8 |
Conclusions
Most custodial staff performed considerably better than expected on the PRA, both in individual elements and the PRA as a whole, which indicates that most staff are fitter than might be expected from the initial validation study results. The low number of results in the red zone (well below average) appears to be a consequence of both the generally higher standard of fitness and, possibly, the substantial number of deferrals and incomplete PRAs (11.9% of those rostered to complete PRA).
The differences in the means between male and female candidates on all the timed or measured elements is about half a standard deviation (ranging from 0.38SD for Walk 2 to 0.67SD for the C&R simulation). The difference is sufficiently substantial to warrant a more detailed analysis once the whole cohort of custodial staff has completed the PRA.
When the whole cohort of custodial staff has completed the PRA once, the available data will allow a more detailed analysis specifically aimed at clarifying any age or gender related differences. Until that time the performance standards should remain unchanged.
It is especially pleasing to note that most members of the custodial staff exceed the minimum standard of physical readiness required to cope with the physically demanding aspects of their role, ensuring that the safety of both staff and prisoners is not compromised by any deficit in staff fitness. It is also gratifying to see the benefits of the support programme; to quote one staff member:
“I thank the department for helping me become a healthy version of me. Good for me, great for my family and more importantly I am more able to assist my work colleagues in a time of need.”
References
Alberta Correctional Services. (2018) COPAT. Retrieved from https://www2.gov.bc.ca/assets/gov/careers/for-job-seekers/current-bc-government-job-postings/featured-careers/corrections_physical_abilities_test.pdf.
Jamnik, V. K., Thomas, S. G., Burr, J. F., & Gledhill, N. (2010). Construction, validation, and derivation of performance standards for a fitness test for correctional officer applicants. Applied Physiology, Nutrition, and Metabolism, 35(1), 59-70
[1] Analysis of Variance (ANOVA) is a statistical method in which the variation in a set of observations is divided into distinct components that indicate if the group means of the dependent variables differ.