Prison facts and statistics - March 2015
This page shows statistical information on the:
- number of prisoners in each prison
- total prison population
- breakdowns of the prison population by
Number of prisoners in each prison
| Prison | Remand Prisoners | Sentenced Prisoners | Total |
|---|---|---|---|
| Total Male Prisoners | 1,891 | 6,296 | 8,187 |
| Auckland | 1 | 622 | 623 |
| Christchurch Men's | 267 | 654 | 921 |
| Hawke's Bay | 125 | 486 | 611 |
| Invercargill | 51 | 113 | 164 |
| Manawatu | 72 | 212 | 284 |
| Mt Eden Corrections Facility | 745 | 250 | 995 |
| Northland Corrections Facility | 54 | 386 | 440 |
| Otago Corrections Facility | 65 | 368 | 433 |
| Rimutaka | 184 | 814 | 998 |
| Rolleston | 0 | 256 | 256 |
| Spring Hill Corrections Facility | 1 | 888 | 889 |
| Tongariro/Rangipo | 0 | 395 | 395 |
| Waikeria | 258 | 492 | 750 |
| Whanganui | 68 | 360 | 428 |
| Total Female Prisoners | 131 | 420 | 551 |
| Arohata | 19 | 61 | 80 |
| Auckland Women's Corrections Facility | 95 | 292 | 387 |
| Christchurch Women's Corrections Facility | 17 | 67 | 84 |
| Total | 2,022 | 6,716 | 8,738 |
Total prison population
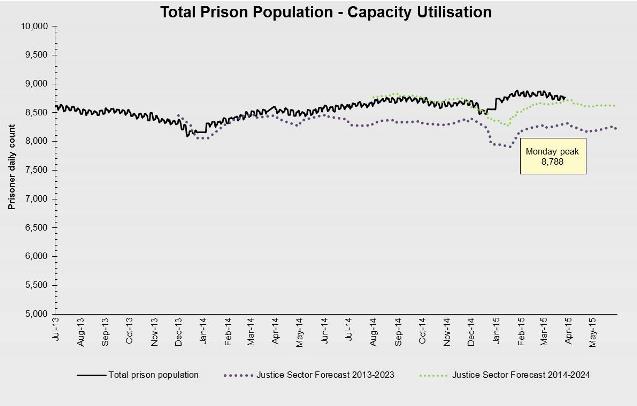
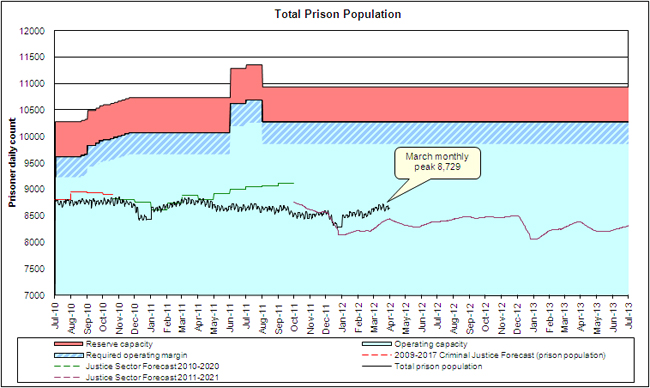
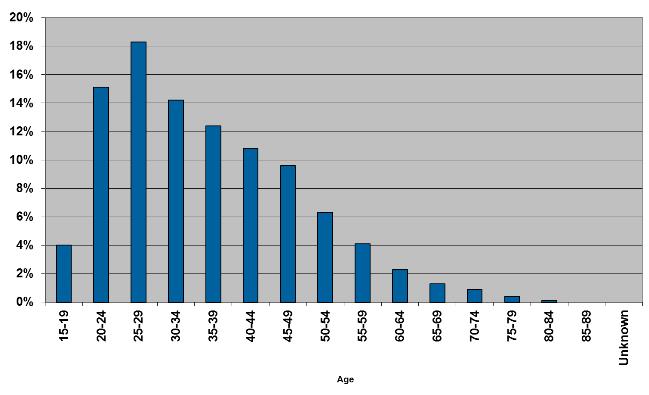
Percentage of prisoners in different age groups
Percentage of sentenced prisoners according to most serious* offence type
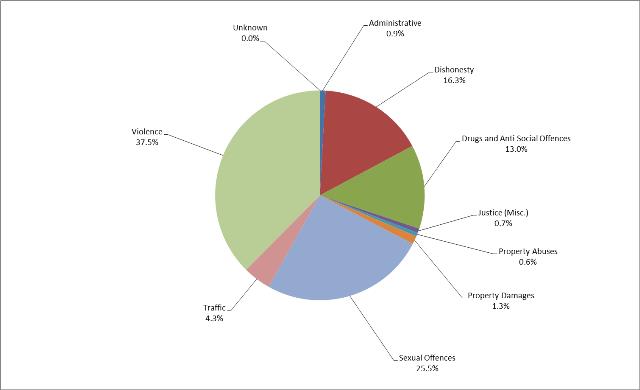
* Prisoners may be convicted of offences across multiple categories. This information is based on the most serious offence a prisoner is convicted of.
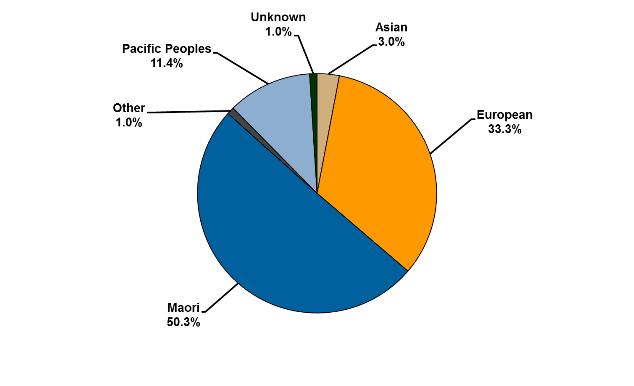
Ethnicity of prisoners
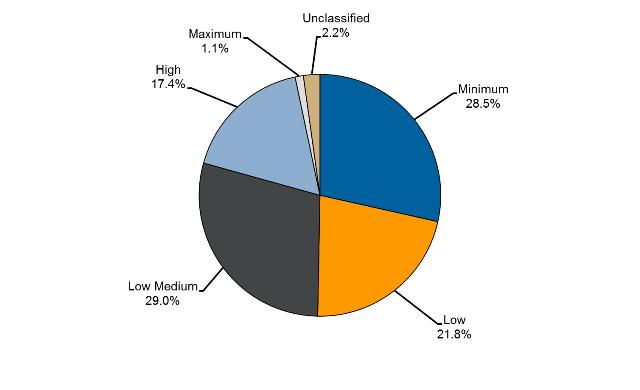
Security classification of sentenced prisoners
Percentage of sentenced prisoners on indeterminate sentences*
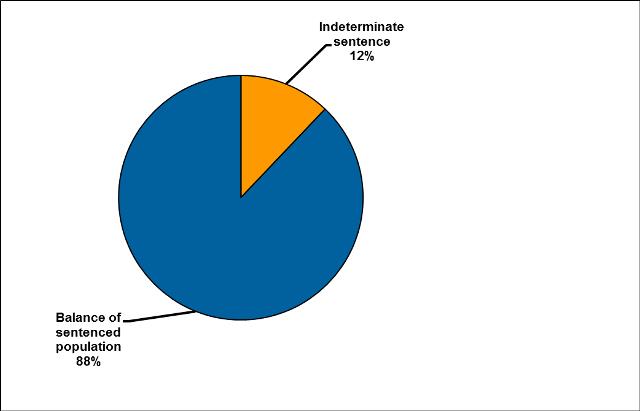
* Indeterminate sentences refer to preventive detention and life sentences that have no end date. Prisoners on these sentences are only released at the discretion of the Parole Board and are subject to recall to prison if released on parole.