Community sentences and orders statistics - December 2014
This page shows statistical information on the:
- Number of sentences and orders being served around the country
- Total number of sentences and orders being served
- The percentage of different types of sentences and orders
- Breakdown of the offender population by:
Number of sentences and orders by area
| Location | Sentences | Orders | Total |
| Auckland | 2,789 | 644 | 3,433 |
| Manukau | 4,318 | 773 | 5,091 |
| Taitokerau | 1,790 | 512 | 2,302 |
| Waitemata | 2,952 | 524 | 3,476 |
| Bay of Plenty | 1,834 | 374 | 2,208 |
| Taupo/Rotorua | 1,442 | 391 | 1,833 |
| Waikato | 2,533 | 656 | 3,189 |
| East Coast | 1,752 | 509 | 2,261 |
| Wairarapa/Manawatu | 1,472 | 423 | 1,895 |
| Wellington | 1,694 | 489 | 2,183 |
| Whanganui/Taranaki | 1,121 | 325 | 1,446 |
| Canterbury | 2,762 | 772 | 3,534 |
| Nelson/West Coast | 1,116 | 207 | 1,323 |
| Otago | 1,012 | 338 | 1,350 |
| Southland/Cental Otago | 691 | 229 | 920 |
| Other | 4 | 3 | 7 |
| Total | 29,282 | 7,169 | 36,451 |
* Refers to the total number of sentences and orders being served. An individual offender can be serving more than one sentence and/or order at any time.
Total number of sentences and orders* (monthly snapshot)
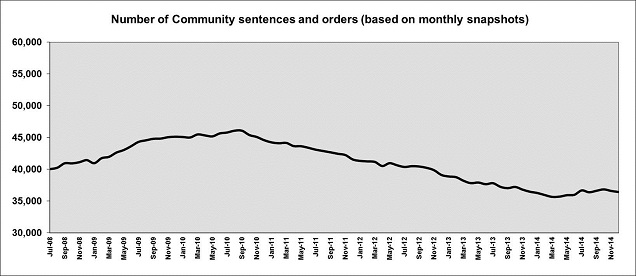
* Refers to the total number of sentences and orders being served. An individual offender can be serving more than one sentence and/or order at any time.
Proportion of different sentences and orders*
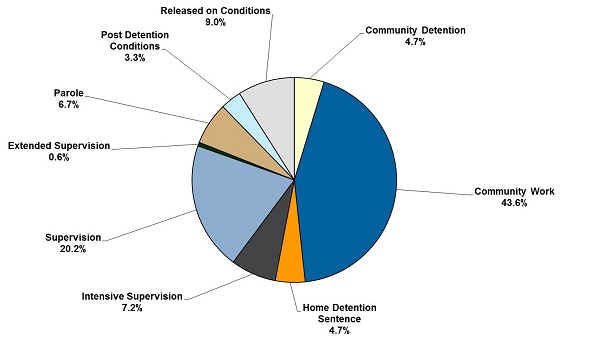
* Refers to the total number of sentences and orders being served. An individual offender can be serving more than one sentence and/or order at any time.
Percentage of offenders serving community sentences and orders in different age groups
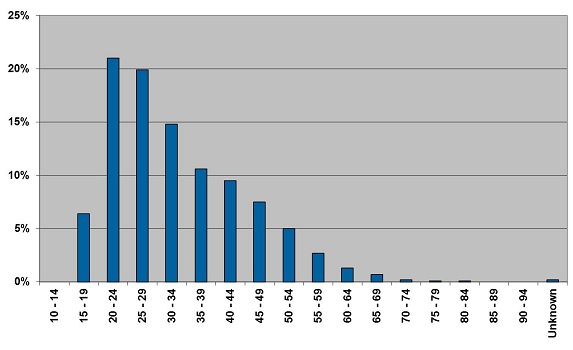
* This graph relates to the number of individual offenders serving sentences or orders in the community. An offender can be serving more than one sentence and/or order at any time.
Percentage of offenders serving community sentences and orders according to most serious* offence type
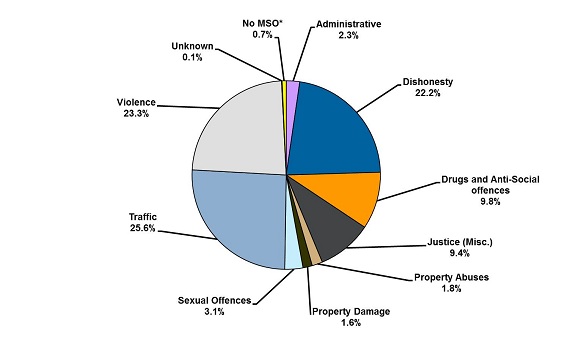
* Offenders may be convicted of offences across multiple categories. This information is based on the most serious offence a prisoner is convicted of.
Gender of offenders serving community sentences and orders
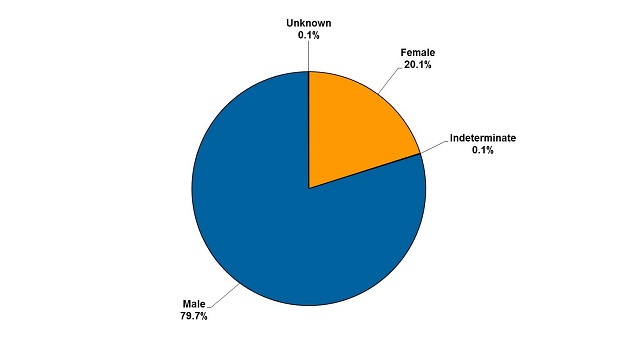
* This graph relates to the number of individual offenders serving sentences or orders in the community. An offender can be serving more than one sentence and/or order at any time.
Ethnicity of offenders serving community sentences and orders
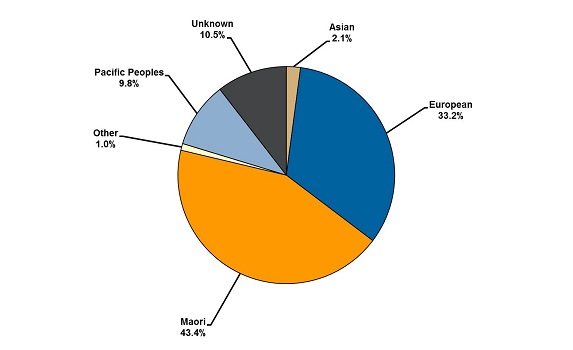
* This graph relates to the number of individual offenders serving sentences or orders in the community. An offender can be serving more than one sentence and/or order at any time.