Prison facts and statistics - June 2011
This page shows statistical information on the:
- number of prisoners in each prison
- total prison population
- breakdowns of the prison population by
- percentage of prisoners on life or preventive detention sentences
- New Zealand's rate of imprisonment compared to other countries
- other facts and figures.
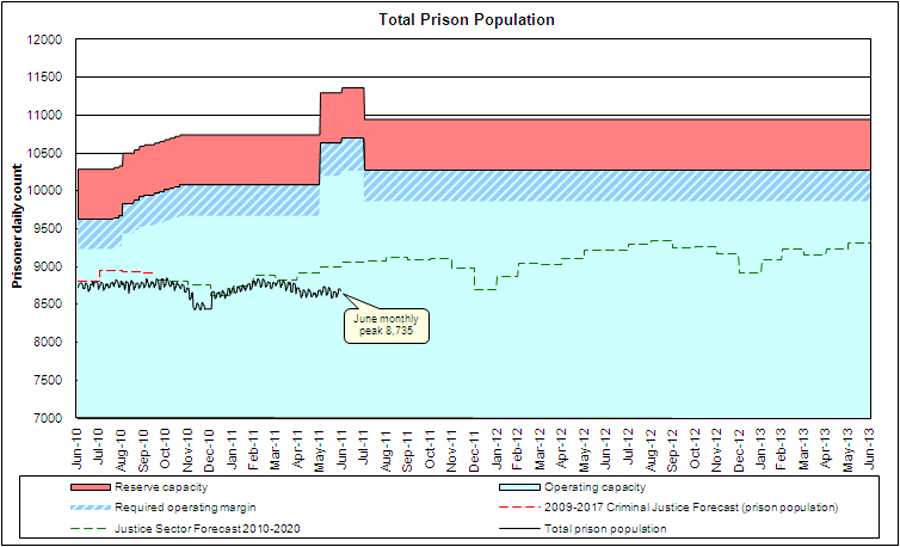
Total prison population
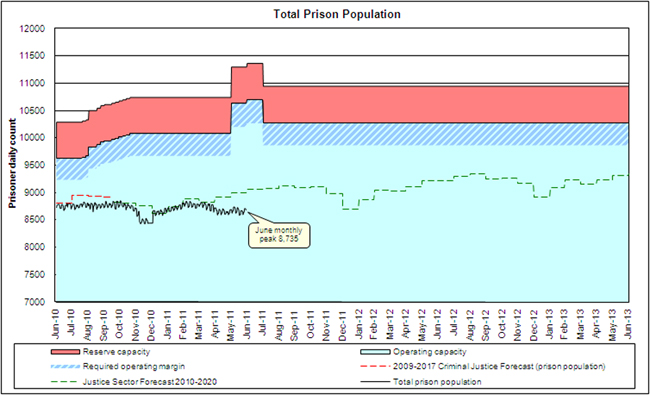
View a larger version of the total prison population graph.
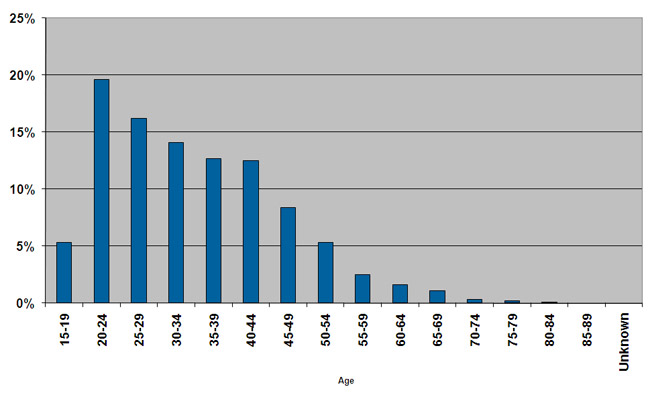
Percentage of prisoners in different age groups
Percentage of sentenced prisoners according to most serious* offence type
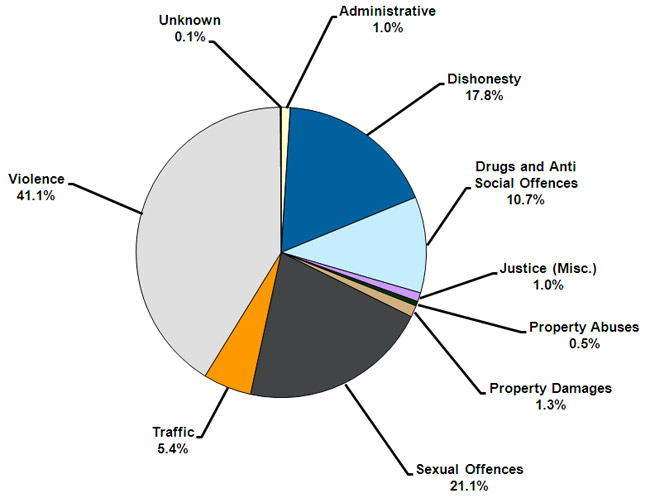
* Prisoners may be convicted of offences across multiple categories. This information is based on the most serious offence a prisoner is convicted of.
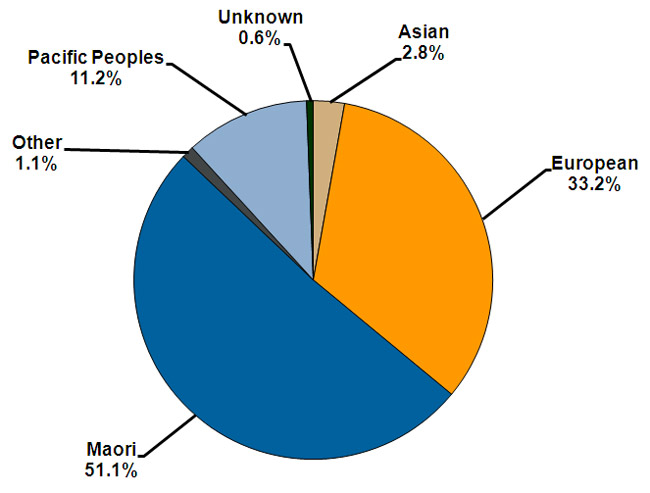
Ethnicity of prisoners
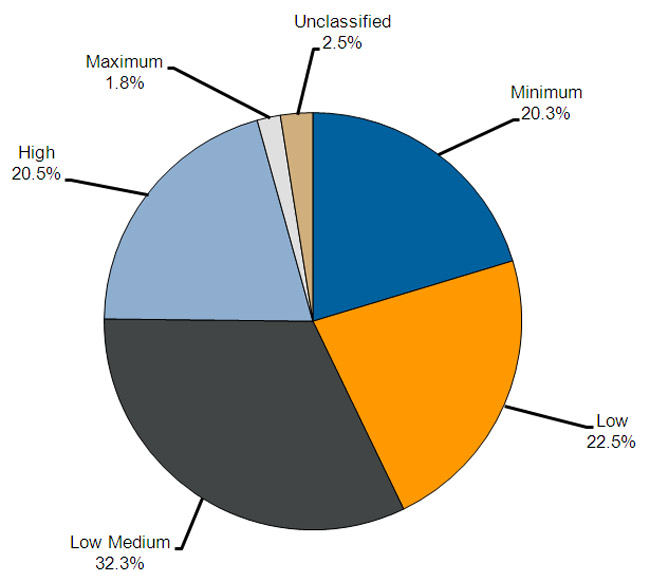
Security classification of sentenced prisoners
Percentage of sentenced prisoners on indeterminate sentences*
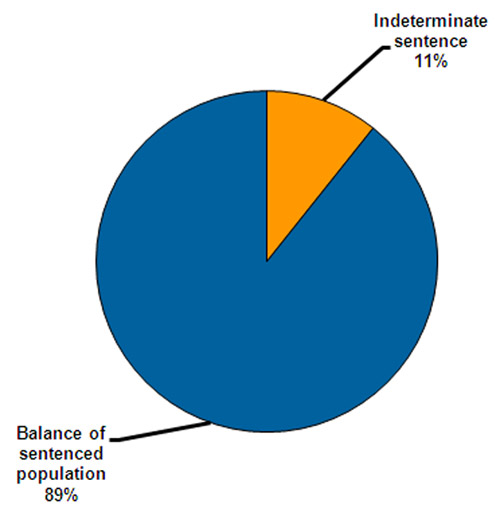
* Indeterminate sentences refer to preventive detention and life sentences that have no end date. Prisoners on these sentences are only released at the discretion of the Parole Board and are subject to recall to prison if released on parole.
International rates of imprisonment
Number of prisoners per 100,000 population | |
| United States | 748 |
| South Africa | 324 |
| New Zealand | 199 |
| Scotland | 153 |
| England and Wales | 152 |
| Australia | 134 |
| Canada | 117 |
| Norway | 71 |
| Figures reflect the prison and national populations from mid 2009 or mid 2010. | |
Other facts and figures
- Approximately 50 per cent of those released or paroled do not return to prison within four years
- The average annual cost of housing a prisoner is $90,936 or $249.14 per day
- Prisoners are fed at a cost of less than $5 a day per person
- 67 per cent of sentenced prisoners are engaged in employment activity
- 55 per cent of sentenced prisoners are engaged in rehabilitation activity
- 23 per cent of the total prison population are gang members
- Corrections provided 44,596 pre-sentence reports to the judiciary in the 2008/09 financial year
* Most of the figures under Other statistics come from the 2008/09 financial year or from a snapshot at 30 June 2009. Re-imprisonment figures are from a 2008 report Reconviction patterns of released prisoners: A 48-month follow up analysis