Appropriation - Prison-based Custodial Services
This appropriation is limited to the provision of custodial services for offenders lawfully required to be detained in custody. This includes remand prisoners (people awaiting trial and offenders convicted but not yet sentenced), offenders sentenced to imprisonment and any other offender required to be lawfully detained in custody.
WHAT CORRECTIONS DOES
Management of custodial services ensures that prisoners complete the correct imposed sentence or order, comply with the specific restrictions and requirements of their sentence or order, are not harmed, are treated fairly and that their legitimate needs are met. Safe and secure management of custodial facilities maintains public safety, prisoners are safely and securely contained, an appropriate setting for provision of rehabilitative interventions is provided and offenders are held to account.
OPERATING CONTEXT
| 2013 | 2014 | 2015 | 2016 | 2016 | 2017 | |
|---|---|---|---|---|---|---|
| Activity information | Actual volume | Actual volume | Actual volume | Actual volume | Budget volume1 | Forecast volume |
| The number of prisoners received into custody | 14,149 | 13,304 | 14,029 | 15,719 | 19,000 - 20,000 | 15,000 - 16,000 |
| The number of prisoners released from custody | 14,194 | 13,266 | 13,719 | 15,003 | 8,300 - 8,800 | 15,000 - 15,500 |
| The average prison population | 8,614 | 8,460 | 8,732 | 9,193 | 8,500 - 8,750 | 9,250 - 9,500 |
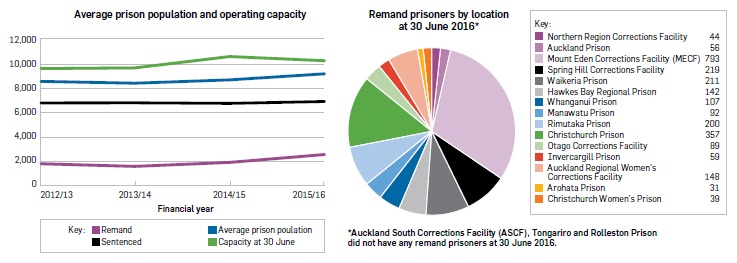
The average prison population in 2015/16 was 461 (5%) higher than in 2014/15 and the population as at 30 June 2016 was 9,532.
The remandee population has risen by 616 prisoners in 2015/16 compared to 2014/15. Remand prisoners represented 27% of the total prison population for 2015/16, compared with 23% for 2014/15.
The average remand period has risen from 59.4 days in 2014/15 to 67.4 days in 2015/16. The rise in the remand population is partly due to court processing time.
The increase of prisoner volumes has an impact across the network including establishing offender plans, scheduling programmes and the level of demand for health services and transportation.

HOW CORRECTIONS PERFORMED
The integrity of sentences and orders
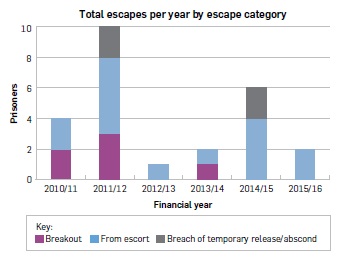
Our ongoing investment in prison infrastructure and efforts to strengthen the custodial management of prisoners, has seen a sustained reduction in breakout escapes from prison. Only one breakout escape has occurred in the last four years and there were zero breakout escapes in 2015/16.
| 2013 | 2014 | 2015 | 2016 | 2016 | 2017 | |
|---|---|---|---|---|---|---|
| Assessment of performance | Actual standard | Actual standard | Actual standard | Actual standard | Budget standard | Budget standard |
| QUALITY | Lower than average across the past 5 years | |||||
| The number of escapes | 1 | 2 | 6 | 2 | 5 | (5) |
Corrections managed over 82,000 prisoner movements this financial year. Just over half of these are between prisons and courts. Two prisoners escaped from escorts: one from court, and one from hospital. Both of these prisoners were captured and subsequently returned to prison. A review is undertaken into each escape, and steps are taken where possible to minimise the occurrence of such events in the future.
As part of our continued effort to ensure that prisoners are held securely while serving sentences, Corrections have invested in infrastructure to reduce the risk of prisoners escaping. By utilising Audio Visual Link (AVL) technology, Corrections can minimise the number of times a prisoner needs to be transported outside of the prison environment and investments in transportation and prison escort vehicles enhance the safety and security of the transports that do occur.

A safe Corrections system
Corrections makes use of a number of measures to monitor our performance in the delivery of custodial services, such as monitoring the prison environment.
| 2013 | 2014 | 2015 | 2016 | 2016 | 2017 | |
|---|---|---|---|---|---|---|
| Assessment of performance | Actual standard | Actual standard | Actual standard | Actual standard | Budget standard | Budget standard |
| QUALITY | ||||||
| The number of prisoner on prisoner assaults that are serious | 55 | 42 | 38 | 45 | 44 | Lower than average across the past 5 years (46) |
| The number of prisoner on staff assaults that are serious | 13 | 6 | 9 | 17 | 10 | Lower than average across the past 5 years (11) |
| The number of justified complaints by prisoners to the Corrections Inspectorate | 37 | 38 | 42 | 38 | 44 | Lower than average across the past 5 years (42) |
| The proportion upheld for not meeting process requirements | - | - | New for 2016 | 84% | 75% | N/A# |
| The percentage of Prison Services Health Centres that retained their Cornerstone® accreditation status following completion of an annual review2 | - | - | New for 2016 | 100% | 100% | 100% |
Although there has been a marginal increase in assaults, this has come at a time when there has been a significant increase in the prison population (an increase of approximately 1,000 prisoners over the last 2 years). Through the implementation of Corrections’ Staff Safety Plan and the creation of tools to support the early identification of risks or heightened tensions, Corrections have continued to make the prison system a safer environment.
Over the last three financial years, there has been a slight increase in the rate of prisoner on staff assaults. This financial year has been adversely affected by two incidents involving the same prisoner. In one event the prisoner assaulted three staff members and in a second event, the same prisoner assaulted another staff member. Our response to all serious assaults includes reviewing the prisoner’s security classification, revoking privileges and referring the matter to police who then determine whether criminal charges should be laid.
There were over 1,000 complaints referred to the Corrections Inspectorate in 2015/16. Of the complaints received, 38 (3.5 percent) were found to be justified. Of the 38 justified complaints, 6 were upheld for reasons of materiality and 32 for not meeting process requirements.
Assault mitigations
2015/16 was the third year of the Staff Safety Plan and Corrections has seen an increase in awareness among staff that any violence towards them is unacceptable. Staff are encouraged to report all incidents of assault, regardless of seriousness.
Through our ‘Keeping each other safe’ initiative all staff have received a Personal Safety booklet, have participated in regular group safety team meetings and have been provided with access to trained regional Corrections welfare officers who provide support as required.
The Health and Safety at Work Act 2015 came into force in April 2016 and Corrections introduced additional safety improvements as a response. Stab resistant body armour has been deployed to Corrections staff, with on-body cameras to be deployed over the next 12 months, both providing better protection when engaging with prisoners. These features are designed to improve safety and security, while maintaining a productive work environment.
During this year Corrections has upgraded the remainder of the prison escort fleet to have single cells for each prisoner. This separation enhancement within the vehicle protects prisoners from potential assaults during transport.
The new Prison Tension Assessment Tool, currently being trialled at Manawatu and Rimutaka Prisons and in parts of Spring Hill Corrections Facility, helps staff to identify and assess daily changes in the overall level of tension and ensures that staff are aware of this prior to beginning their shifts. This information is used by unit and site management to take any specific or site-wide actions that are necessary, to ensure staff and prisoner safety throughout the facility.
The Prison Tension Assessment Tool sits alongside the Dynamic Appraisal of Situational Awareness (DASA) tool, which is targeted more specifically at individual prisoners within a unit (although, if applied across multiple prisoners, it can indicate risk across the unit) and the Promoting Risk Intervention by Situational Management (PRISM) tool, which looks at systemic issues within the prison environment that may be contributing to violence.
Each one of these improvements helps to maintain a safe and secure prison system.
HOW MUCH DID IT COST
For the year ended 30 June 2016
| 2015 | 2016 | 2016 | 2016 | 2017 | |
|---|---|---|---|---|---|
| Actual† $000 | Actual $000 | Budget (unaudited) $000 | Supp. estimates (unaudited) $000 | Forecast* (unaudited) $000 | |
| REVENUE | |||||
| Crown | 790,423 | 840,996 | 811,289 | 846,393 | 896,220 |
| Departmental | 140 | 1,042 | - | 1,085 | - |
| Other | 7,935 | 13,249 | 2,486 | 13,034 | 3,390 |
| Total revenue | 798,498 | 855,287 | 813,775 | 860,512 | 899,610 |
| Total expenses | 791,304 | 853,093 | 813,775 | 858,858 | 899,610 |
| Net surplus | 7,194 | 2,194 | - | 1,654 | - |
† From 2016 the Contract Management of Services Provided by Third Parties appropriation has been integrated into the Prison-based Custodial Services appropriation.
* Forecast financial statements have been prepared using Budget Economic Fiscal Update (BEFU) 2016. The Prison-based Custodial Services appropriation has been merged into a Multi-Category Appropriation call 'Public Safety is Improved' for 2017 in order to align the appropriations with Corrections' strategic outcomes.
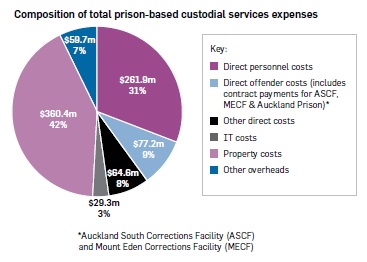
The total expense for this appropriation was $853.1 million. The Corrections network includes 18 prison sites across the country and a significant amount of expenditure therefore relates to costs associated with the ownership, management and operation of these assets; this includes depreciation, asset maintenance and capital charge. Total expenditure also includes payments made to SecureFuture Wiri Limited for the operation and maintenance of the Auckland South Corrections Facility (ASCF).
Personnel costs is another significant cost associated with this appropriation as frontline staff account for a large proportion of Corrections overall staffing numbers.
Refer to the chart for the composition of total expenditure by major expense category.
Actual expenditure was $61.8 million higher than 2015 actuals, mainly due to:
- increased contract costs of $36.5 million, relating to a full year of operations at ASCF which opened in May 2015
- increased asset ownership costs of $15.1 million, including capital charge and depreciation, of which $7.0 million relates to a full year depreciation impact of ASCF
- increased personnel costs including the impact of the annual remuneration review and the management of a higher prison population.
Other revenue mainly comprises proceeds received from Serco in full settlement of costs incurred by Corrections due to the Step-In at MECF, insurance proceeds received in 2015/16 in relation to the Spring Hill Corrections Facility riot costs that were incurred in previous years and board charged to prisoners on Release to Work.

1 The 2016 budget volumes for number of prisoners received into custody counted all receptions (remand and sentenced prisoners) regardless of time outside of prison. This definition has been revised to include all new receptions after 72 hours of release. The 2016 budget volume for prisoners released from custody only counted sentenced prisoners. The 2016 actual volumes include remandees.
# This measure has been excluded from the 2016/17 budget and will not be reported in this section in 2017.
2 To demonstrate that the level of care in prison meet the standards of care that are available in the community, all health centres are required to be accredited under the Cornerstone® process. The accreditation process demonstrates that prison health centres meet the Royal New Zealand College of General Practitioners (NZCGP) Aiming for Excellence Standards for New Zealand general practice. In order to retain their accreditation, each health centre undertakes an internal review annually and updates the NZCGP on completion.

